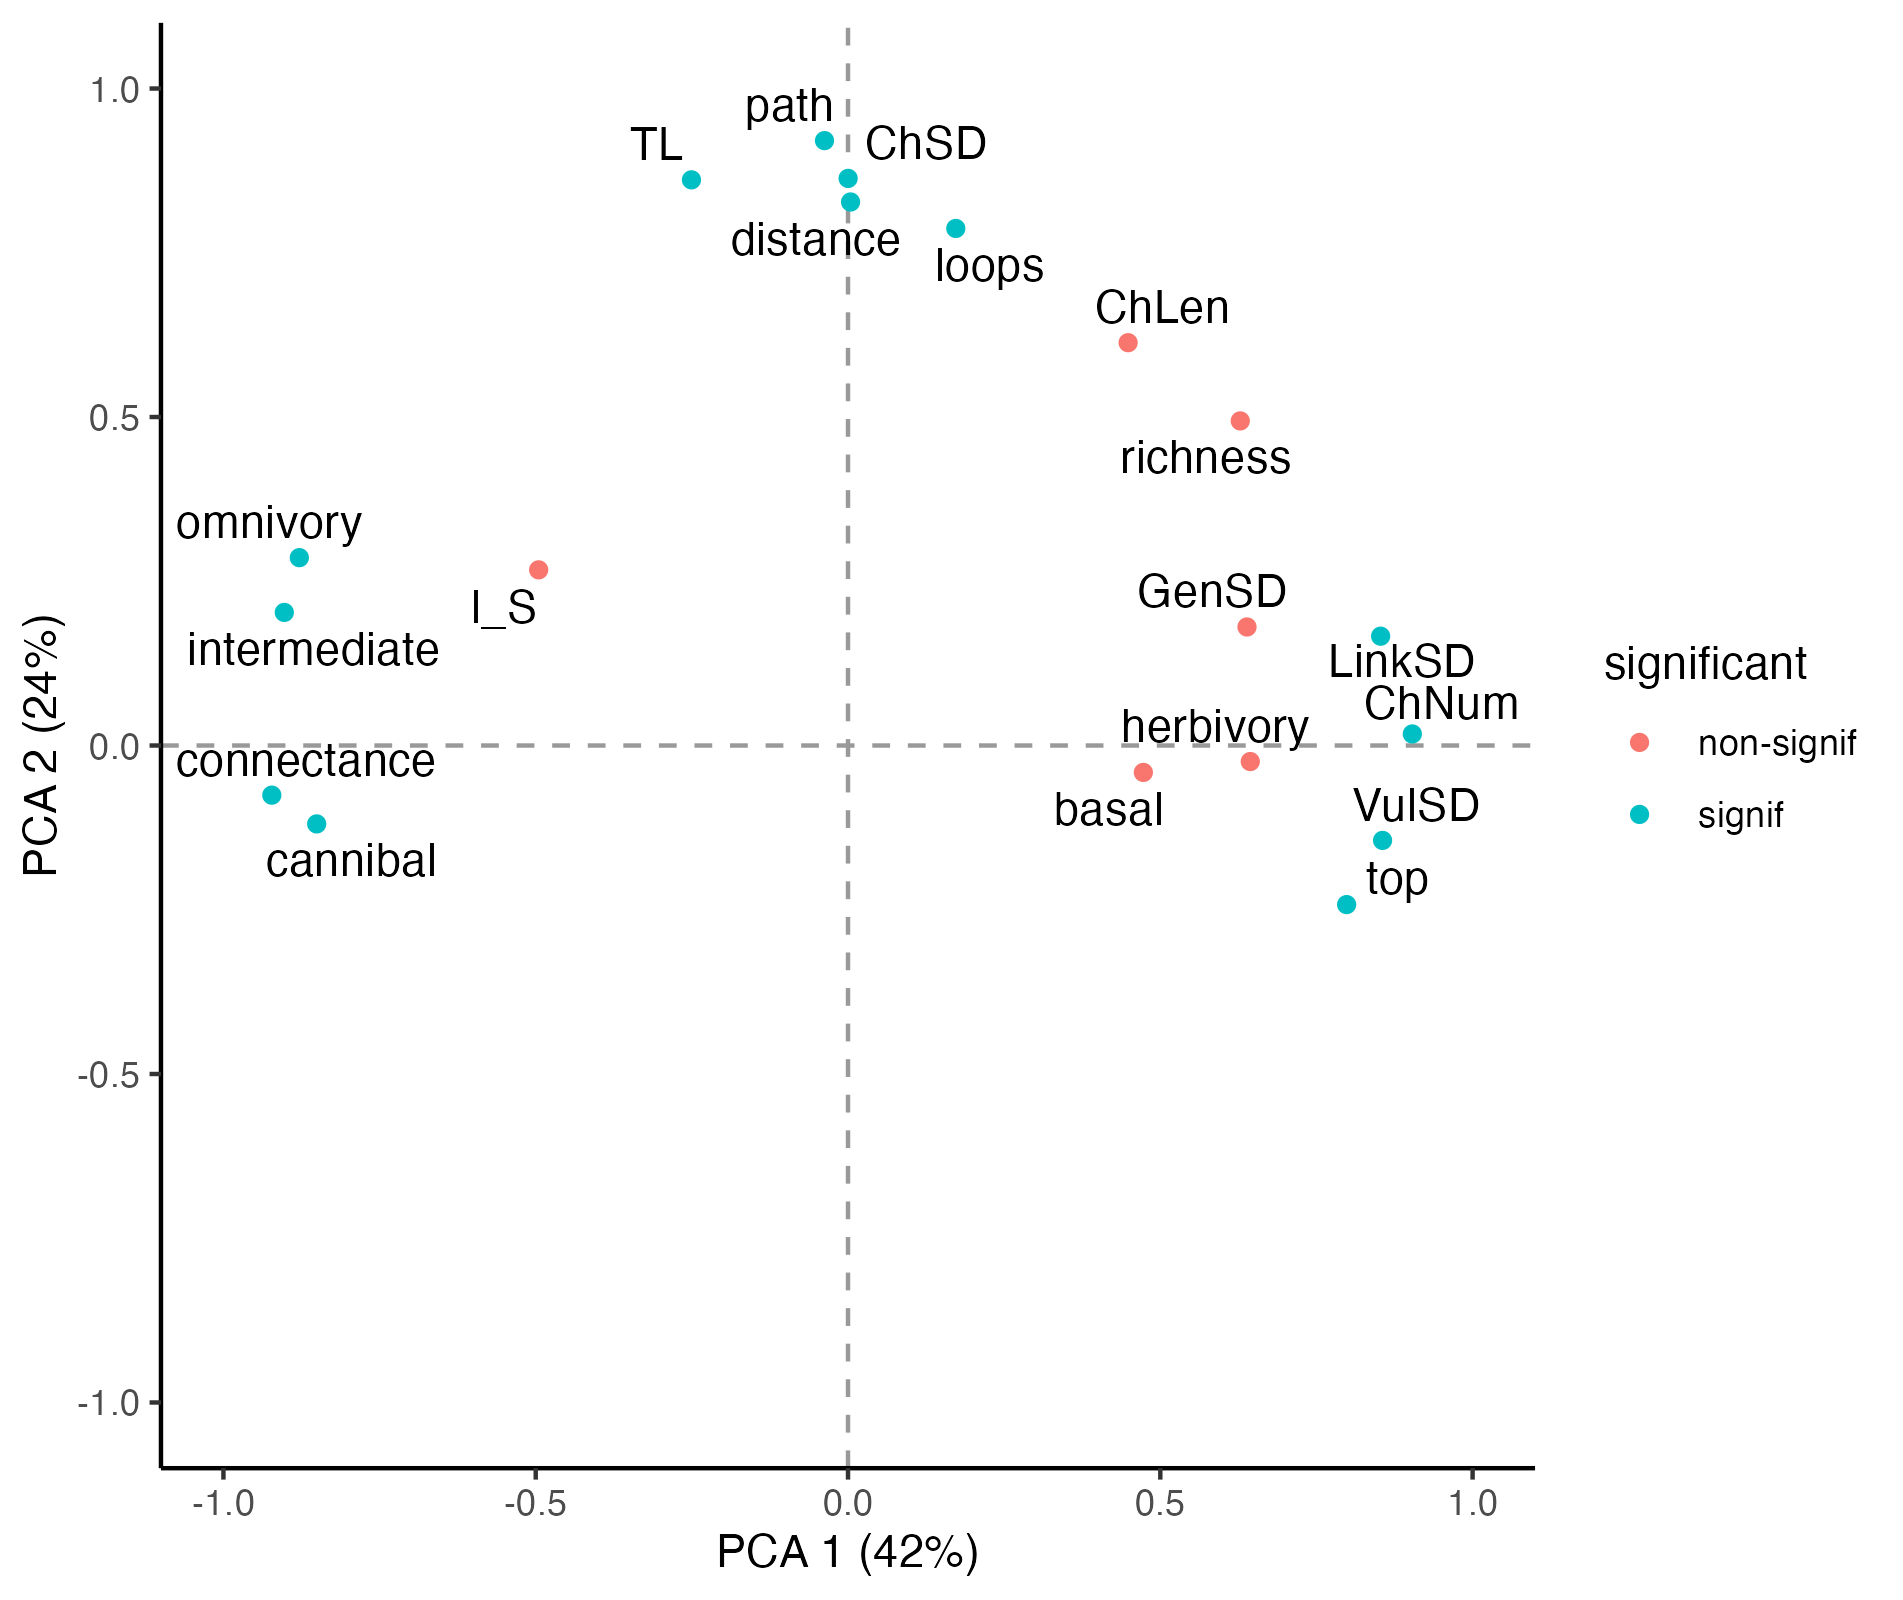
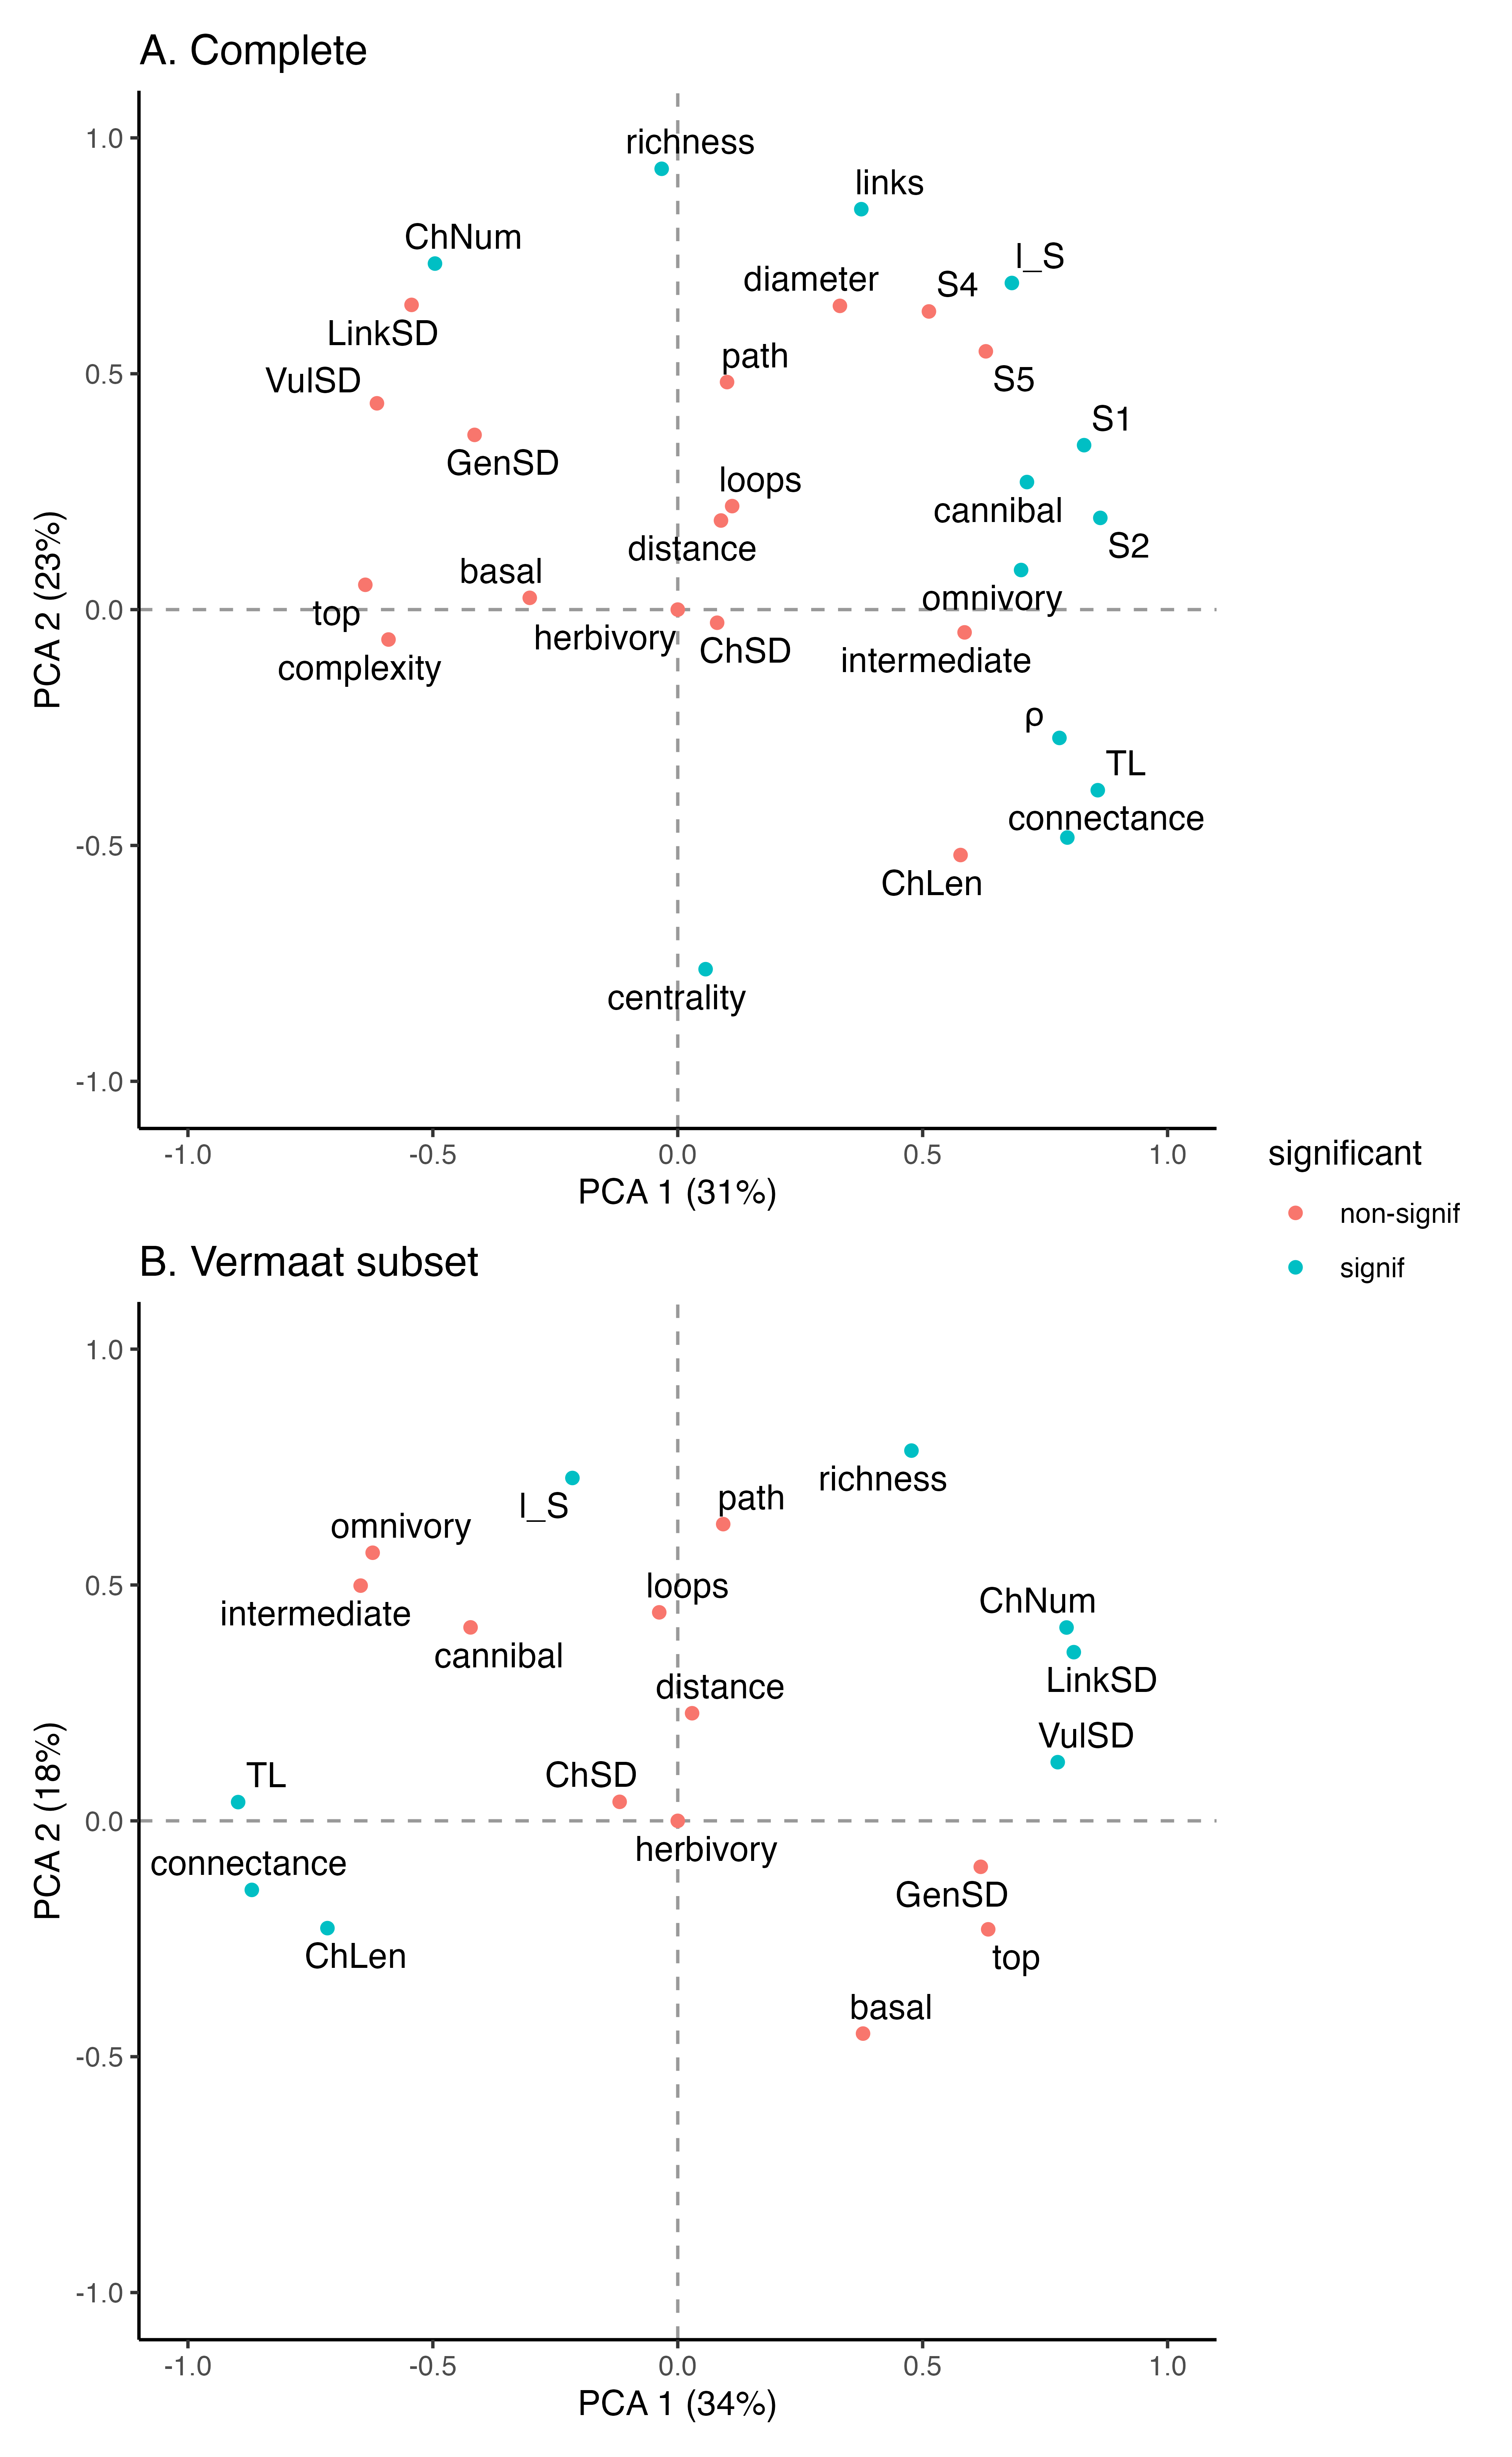
| Basal |
Percentage of basal taxa, defined as species who have a vulnerability of zero |
Measures the energy entry points; high basal % suggests a bottom-heavy, potentially more stable energy base. |
|
| Connectance |
\(L/S^2\), where \(S\) is the number of species and \(L\) the number of links |
|
|
| Cannibal |
Percentage of species that are cannibals |
|
|
| ChLen |
Mean food chain length, averaged over all species (where a food chain is defined as a continuous path from a ‘basal’ to a ‘top’ species) |
Reflects energy transfer efficiency. Longer chains may be more prone to top-down trophic cascades. |
|
| ChSD |
Standard deviation of ChLen |
High SD indicates a mix of energy pathways, which can buffer the system |
|
| ChNum |
log number of food chains |
|
|
| Clust |
mean clustering coefficient (probability that two taxa linked to the same taxon are also linked) |
Quantifies local redundancy; high clustering can buffer the network against the loss of specific interaction pathways. |
TODO
Watts and Strogatz (1998) |
| GenSD |
Normalized standard deviation of generality of a species standardized by \(L/S\) |
Interaction asymmetry. High variance in how links are distributed often points to the presence of ‘hubs’ (highly connected species), which makes the network robust to random loss but vulnerable to targeted ‘keystone’ removal. |
Williams and Martinez (2008) |
| Herbivore |
Percentage of herbivores plus detritivores (taxa that feed only on basal taxa) |
|
|
| Intermediate |
Percentage of intermediate taxa (with both consumers and resources) |
|
|
| LinkSD |
Normalized standard deviation of links (number of consumers plus resources per taxon) |
Interaction asymmetry. High variance in how links are distributed often points to the presence of ‘hubs’ (highly connected species), which makes the network robust to random loss but vulnerable to targeted ‘keystone’ removal. |
|
| Loop |
Percentage of taxa in loops (food chains in which a taxon occurs twice) |
High percentages of loops can lead to feedback cycles (positive or negative) that either amplify or dampen oscillations, directly impacting local stability. |
|
| L/S |
links per species |
|
|
| MaxSim |
Mean of the maximum trophic similarity of each taxon to other taxa, the number of predators and prey shared by a pair of species divided by their total number of predators and prey |
Indicates functional redundancy; high similarity suggests species are replaceable, increasing robustness to individual extinctions. |
TODO
Yodzis and Winemiller (1999) |
| Omnivory |
Percentage of omnivores (taxa that feed on \(\geq\) 2 taxa with different trophic levels) |
Links to coupling of energy channels; historically debated, but often found to stabilize food webs by diffusing top-down pressure. |
McCann (2000) |
| Path |
characteristic path length, the mean shortest food chain length between species pairs |
|
|
| Richness |
Number of nodes in the network |
|
|
| TL |
Prey-weighted trophic level averaged across taxa |
|
Williams and Martinez (2004) |
| Top |
Percentage of top taxa (taxa without consumers) |
|
|
| VulSD |
Normalized standard deviation of vulnerability of a species standardized by \(L/S\) |
Interaction asymmetry. High variance in how links are distributed often points to the presence of ‘hubs’ (highly connected species), which makes the network robust to random loss but vulnerable to targeted ‘keystone’ removal. |
|
| Links |
The number of links in the network |
|
|
| Diameter |
Diameter can also be measured as the average of the distances between each pair of nodes in the network |
|
Delmas et al. (2019) |
| \(\rho\) |
Spectral radius is a a conceptual analog to nestedness. It is defined as the absolute value of the largest real part of the eigenvalues of the undirected adjacency matrix |
Acts as a proxy for system-wide resilience; captures the speed at which a system returns to equilibrium after a small pulse perturbation. |
Staniczenko et al. (2013) |
| Complexity |
SVD complexity of a network, defined as the Pielou entropy of its singular values |
Captures structural heterogeneity; distinguishes between a truly complex system and one that is merely large or ‘random’. |
Strydom et al. (2021) |
| Centrality |
Centrality is a measure of how ‘influential’ a species is, under various definitions of ‘influence’. |
Centrality can help in quantifying the importance of species in a network |
Estrada and Bodin (2008) |
| S1 |
Number of linear chains |
Building blocks of stability (compartmentalisation, Stouffer and Bascompte?) |
Stouffer et al. (2007) Milo et al. (2002) |
| S2 |
Number of omnivory motifs |
Building blocks of stability (compartmentalisation, Stouffer and Bascompte?) |
Stouffer et al. (2007) Milo et al. (2002) |
| S4 |
Number of apparent competition motifs |
Building blocks of stability (compartmentalisation, Stouffer and Bascompte?) |
Stouffer et al. (2007) Milo et al. (2002) |
| S5 |
Number of direct competition motifs |
Building blocks of stability (compartmentalisation, Stouffer and Bascompte?) |
Stouffer et al. (2007) Milo et al. (2002) |
| Intervality |
The degree to which the prey in a food web can be ordered so that all species can be placed along a single dimension |
Measures niche dimension; high intervality suggests a simpler organization where species feeding habits are constrained by a single trait (like body size). |
Stouffer et al. (2006) |
| Prey:predator |
Ratio of prey (basal + intermediate) to predators (top + intermediate) |
A measure of food web ‘shape’. Values <1 imply an inverted structure and might indicate instability |
|
| Robustness |
Minimum level of secondary extinction that occurs in response to a particular perturbation |
|
Jonsson et al. (2015) |