
1 Introduction
Understanding how biological communities are organised and how species interact is a central goal of ecology. While early efforts focused primarily on species richness and composition, there is growing recognition that communities are structured not only by which species occur, but also by how they interact (Thuiller et al. 2024; Mestre and Bastazini 2026; Gravel et al. 2019; Eisenhauer et al. 2026). Interaction networks are increasingly used as macroecological state variables to compare community organisation across environmental gradients (Tylianakis and Morris 2017), quantify \(\beta\)-diversity in interaction structure (Trøjelsgaard and Olesen 2016; Poisot et al. 2015), evaluate stability–complexity relationships (Allesina and Tang 2012), and assess vulnerability to global change (Hao et al. 2025). Consequently, ecological networks have become central to comparative analyses of communities under future environmental change (Hao et al. 2025; Michalska-Smith and Allesina 2019) as well as understanding environmental transitions across deep time (Dunhill et al. 2024; Roopnarine 2006).
However, ecological networks are rarely fully observed. Interaction data are often incomplete, and sampling effort varies across contemporary, biogeographic, and historical contexts (Sandra et al. 2025; Poisot et al. 2021; Jordano 2016). Interactions and network structure must therefore frequently be inferred through predictive approaches rather than reconstructed directly from observations (Strydom et al. 2021). A key, often implicit, assumption is that the variation in these reconstructed network properties reflects ecological differences among communities rather than methodological artefacts introduced during the construction process (Brimacombe et al. 2023; Fründ et al. 2016).
Interactions are commonly inferred indirectly from traits (e.g., body size), phylogenetic relationships, species co-occurrence, or theoretical constraints (Strydom et al. 2021; Morales-Castilla et al. 2015). Network construction is therefore not simply an observational exercise, but an inference step shaped by assumptions about how interactions arise. Different network prediction frameworks encode different assumptions, representing interactions as either biologically feasible combinations of traits, realised diets shaped by energetic optimisation, or networks constrained by structural properties (Strydom et al. 2026; Gauzens et al. 2025; Petchey et al. 2011; Guimarães 2020). These assumptions act as ‘structural priors’ that can shape network architecture, potentially generating different representations of trophic structure, even for the same species pool. If alternative approaches systematically produce different network configurations, comparisons among communities risk conflating ecological variation with differences imposed by the prediction method. The reliability of macroecological inference therefore depends not only on the available data, but also on the structural assumptions underlying network construction.
Despite rapid methodological development in interaction prediction, and comparisons among methods within individual frameworks (e.g., Allesina et al. (2008) and Pichler et al. (2019)), the extent to which alternative network-construction approaches alter macroecological conclusions remains insufficiently explored. This is consequential for comparative studies, in which network metrics are routinely interpreted as indicators of community properties, dynamics, and differences (Delmas et al. 2018; Allesina and Tang 2012; Poisot et al. 2015). When alternative approaches impose different constraints on interaction topology, apparent differences among communities may partly reflect the assumptions of the framework used for prediction rather than underlying ecological processes. Establishing the sensitivity of macroecological conclusions to these assumptions is therefore essential for interpreting patterns inferred from predicted networks.
Deep-time ecosystems provide a useful context in which to examine this problem. Their trophic interactions cannot be observed directly and must instead be inferred from traits, co-occurrence, and theoretical constraints (Dunne et al. 2008; Dunne et al. 2014; Dunhill et al. 2024; Roopnarine 2006; Smith et al. 2025). Network-based inferences about these systems are consequently dependent on prediction, making the assumptions underlying alternative approaches both unavoidable and potentially consequential. Here, we use the Early Toarcian Extinction Event (ETEE; ~183 Ma) as a case study. Recent work by Dunhill et al. (2024) used reconstructed food webs to infer changes in community stability and structure during this event, concluding that the extinction selectively affected specialist and infaunal organisms, producing simplified ecosystems increasingly dominated by ecological generalists and opportunistic taxa. Rather than treating these conclusions as independent of the reconstruction method, we ask a broader question – to what extent are ecological inferences about the ETEE contingent on the model used to reconstruct trophic interactions?
To address this question, we reconstruct ecological networks for four successive assemblages spanning the ETEE using six contrasting prediction approaches that represent feasibility-based, realised, and structural approaches to network construction. By holding species composition constant while varying the prediction method, we isolate the influence of model choice on inferred network structure and the ecological conclusions derived from it. We assess whether conclusions drawn from a single framework, including those of Dunhill et al. (2024), remain robust across alternative, equally plausible representations of interaction structure, or whether different approaches yield substantially different interpretations of ecological change. More broadly, this case study examines how strongly macroecological conclusions derived from ecological networks depend on the assumptions embedded in the approaches used to construct them.
2 Methods
2.1 Study system and fossil data
We used fossil occurrence data from the Cleveland Basin spanning the late Pliensbachian to the late Toarcian, encompassing the ETEE and subsequent ecological recovery. To characterise changes in network structure across this interval, we defined four successive paleo-assemblages: pre-extinction (Pliensbachian–early Toarcian), post-extinction (early Toarcian), early recovery (early–middle Toarcian), and late recovery (late Toarcian). For each taxon, we recorded body size and characterised ecological traits using Bambach’s ecospace framework (Bambach et al. 2007), coding tiering, motility, and feeding mode following Dunhill et al. (2024). Each paleo-assemblage was treated as a community of potentially interacting taxa. The dataset comprised 57 taxa representing diverse marine groups, including cephalopods, bivalves, gastropods, and vertebrates. Further details on the dataset, including taxonomic composition, trait coding, and temporal resolution, are provided in Dunhill et al. (2024).
2.2 Network construction models
2.2.1 Conceptual classification of network types
In this study, model is used as an umbrella term for frameworks that encode assumptions about trophic interactions and generate ecological networks from specified inputs. Although these approaches differ in theoretical foundations and in their mechanistic, statistical, or structural character, this operational definition enables consistent comparison of the ecological hypotheses they represent.
We classify network reconstruction models into three conceptual classes: feasibility-based, realised, and structural models, each representing distinct hypotheses about how trophic interactions arise and constrain food-web structure (Strydom et al. 2026).
Feasibility-based models identify biologically possible consumer–resource interactions using trait compatibility or mechanistic rules, defining a feasible interaction space without necessarily predicting which interactions occur in a specific community. In paleoecological contexts, they translate trait information and expert knowledge into biologically grounded predictions when direct interaction observations are unavailable (e.g., Fricke et al. (2022); Roopnarine (2006); Shaw et al. (2024)).
Realised models estimate the subset of feasible interactions expected under ecological constraints, incorporating factors such as energetic optimisation, mechanical limitations, or probabilistic trait relationships to predict putatively realised diets (Schneider et al. 2016; Brose et al. 2006). Unlike feasibility-based models, they explicitly represent assumptions about resource selection and the processes shaping interactions.
Structural models generate networks using general topological rules governing properties such as species richness, connectance, or trophic organisation, rather than species-specific ecological information (Allesina et al. 2008). They therefore do not reconstruct community-specific interactions but provide theoretical reference networks analogous to null models.
We selected six models to sample distinct assumptions rather than exhaustively compare available methods (Table 1): one feasibility-based model (PFWIM), three realised models (ADBM, ATN, Body-size ratio), and two structural models (Random, based on the Erdős–Rényi framework, and Niche). Together, they represent alternative approaches to translating species information or general structural constraints into network predictions.
| Model | Assumptions | Data needs | Limitation | Network type | Key reference | Usage examples |
|---|---|---|---|---|---|---|
| Random | Links assigned randomly | Species richness, number of links | Parameter assumptions, species agnostic | Structural | Erdős and Rényi (1959) | Null-model comparisons; testing whether observed network structure (connectance, motifs) deviates from random expectations |
| Niche | Species ordered along a ‘niche axis’; interactions interval-constrained | Species richness, connectance | Parameter assumptions, species agnostic | Structural | Williams and Martinez (2008) | Evaluating trophic hierarchy and motif structure; baseline structural predictions |
| Allometric diet breadth model (ADBM) | Energy-maximizing predator diets | Body mass, abundance/biomass | Assumes optimal foraging; does not account for forbidden links | Realised | Petchey et al. (2008) | Predicting realized predator diets; exploring secondary extinctions |
| Allometric trophic network (ATN) | Links constrained by body-size ratios and functional response | Body mass, number of basal species | Assumes only mechanical/energetic constraints | Realised | Brose et al. (2006); Gauzens et al. (2023) | Simulating species loss; evaluating network collapse dynamics |
| Paleo food web inference model (PFWIM) | Interactions inferred using trait-based mechanistic rules | Feeding traits | Assumes feeding mechanisms; trait resolution required | Feasibility | Shaw et al. (2024) | Mapping feasible trophic interactions; assessing secondary extinctions |
| Body-size ratio model | Probabilistic assignment of links based on predator–prey size ratios | Body mass | Does not account for forbidden links | Realised | Rohr et al. (2010) | Estimating likely interactions; simulating cascading effects. |
Although models may share inputs (e.g., body mass in ADBM, ATN, and Body-size ratio), they differ in how these constrain trophic interactions. Thus, network differences may reflect both input data (e.g. functional traits vs body size) and the ecological assumptions and structural constraints encoded by each model. We selected PFWIM because it formalises biologically possible consumer–resource relationships in a framework applicable across datasets, offering a transferable alternative to system-specific expert assignment of links, although other approaches exist (e.g., Roopnarine (2006)).
This classification enables us to assess how assumptions about trophic interactions influence network structure and ecological interpretation. By holding species composition constant while varying models, we assess whether differences in network properties and macroecological conclusions reflect model assumptions rather than species composition.
2.2.2 Network generation and replication
We evaluated six network reconstruction models using the approaches listed in Table 1, with expanded descriptions of model assumptions, parameterisation, and link-generation rules are provided in Supplementary Material S1, including full mathematical formulations and parameter definitions. For each community, 100 stochastic network realisations were generated per model (n = 2400 in total, 600 per time bin). Of the simulated networks we excluded those that had a network metric that was considered an outlier (\(> 3\sigma\) from the mean). This resulted in the removal of 13 networks (of which 3 were ATN model networks and the rest Random model networks), typically due to very large trophic level values. Continuous body sizes were assigned from the categorical size classes. This was done by sampling from a truncated lognormal distribution, with the upper and lower bounds of each size class serving as the boundaries. Alternative body size distributions (lognormal and uniform) were tested and shown to have a minimal impact on topology (Supplementary Material S1; Figure S1). Random and Niche models were parameterised using connectance values drawn from an empirically realistic range (0.05–0.25; Curtsdotter et al. (2011)). For the Random model, which requires link number explicitly, connectance (Co) was first converted to expected link number (L) using \(L = Co\times S^2\), ensuring consistency in network density across all models. Richness (S) was determined by the number of taxa for each time bin. For the Body-size ratio model, we followed the approach of Yeakel et al. (2014) using only the body-mass scaling to determine links between species. Sensitivity of network structure to these parameter choices is evaluated in Supplementary Material S1. The PFWIM generates a deterministic metaweb for a given trait configuration. To allow for statistical analyses we introduced variation by applying a downsampling procedure that randomly pruned links until the connectance of the network decreased by 0.01. This step allowed us to introduce statistical variation while still preserving most of the original metaweb structure. The choice of the magnitude of connectance change and its effects on network structure are discussed in Supplementary Material S1.
2.3 Network metrics and structural analyses
We quantified network structure using a suite of network metrics (Table 2), capturing overall network properties, motif structure, and species-level variability. Differences among models were assessed using a multivariate analysis of variance (MANOVA), with model identity as a fixed factor and the full set of network metrics as response variables. Variance partitioning was further assessed using permutational multivariate analysis of variance (PERMANOVA). Pairwise interaction turnover was quantified using link-based \(\beta\)-diversity and was calculated following the framework of Poisot et al. (2012), among four of the models (ADBM, ATN, body-size ratio, and PFWIM). Random and Niche models were excluded because they are species-agnostic models that generate networks matching broad topological properties (e.g., connectance and degree distributions) rather than predicting biologically realistic species-specific interactions. Specifically, we looked at interaction rewiring among shared species (\(\beta_{OS}\), see S1 for additional details on the decomposition of interaction \(\beta\)-diversity and its implementation), which allows separation of differences arising from altered interaction identities among species common to both networks. Because all networks within a given assemblage are constructed from the same species pool, differences in interaction structure primarily reflect ‘rewiring’ of trophic links due to stochasticity in the model rather than species turnover. All calculations were performed for all model combinations within the same assemblage (time bin).
| Metric | Definition | Reference |
|---|---|---|
| Connectance | \(L/S^2\), where \(S\) is the number of species and \(L\) the number of links | Williams and Martinez (2004) |
| Maximum trophic level | Prey-weighted trophic level averaged across taxa | Williams and Martinez (2004) |
| Trophic Index (NDTI) | Normalised difference between the number of S1 (linear chains) and S2 (omnivory) motifs \((S1 - S2)/(S1 + S2)\) | Milo et al. (2002); Dansereau et al. (2024) |
| Competition index (NDCI) | Normalised difference between the number of S4 (exploitative competition) and S5 (apparent competition) motifs \((S4 - S5)/(S4 + S5)\) | Milo et al. (2002); Dansereau et al. (2024) |
| Generality | Standard deviation of normalised generality of all species within network, normalised by \(L/S\) | Williams and Martinez (2000) |
| Vulnerability | Standard deviation of normalised vulnerability of all species within network, normalised by \(L/S\) | Williams and Martinez (2000) |
2.4 Extinction simulations and their evaluation
Following Dunhill et al. (2024), we simulated species loss from pre-extinction networks under trait-based, network-position–based, and random removal scenarios. Species were deleted sequentially, with cascading secondary extinctions allowed to propagate. Simulated post-extinction states were compared to observed (i.e., reconstructed from fossil occurrence data) networks using mean absolute differences (MAD) of food web metrics (Table 2) and modified true skill statistics (TSS) calculated separately at the node level (species presence/absence) and link level (presence/absence of interactions between species pairs). Scenarios were ranked within each model based on MAD and TSS performance, and Kendall’s rank correlation coefficient (\(\tau\)) was used to quantify agreement in scenario ordering across models. Detailed implementation of extinction sequences and secondary extinction rules is provided in Supplementary Material S1.
2.5 Software and Reproducibility
Ecological network reconstruction and extraction of structural metrics were conducted in Julia v1.12.7 (Bezanson et al. 2017) using the model implementations provided in Supplementary Material S1. All statistical analyses, including MANOVA, PERMANOVA, and post hoc comparisons, were performed in R v4.5.2 (R Core Team 2024). The full analytical workflow, including data preprocessing, network generation, extinction simulations, and metric calculation, is fully reproducible from the archived codebase.
3 Results
3.1 Network structure differs among models
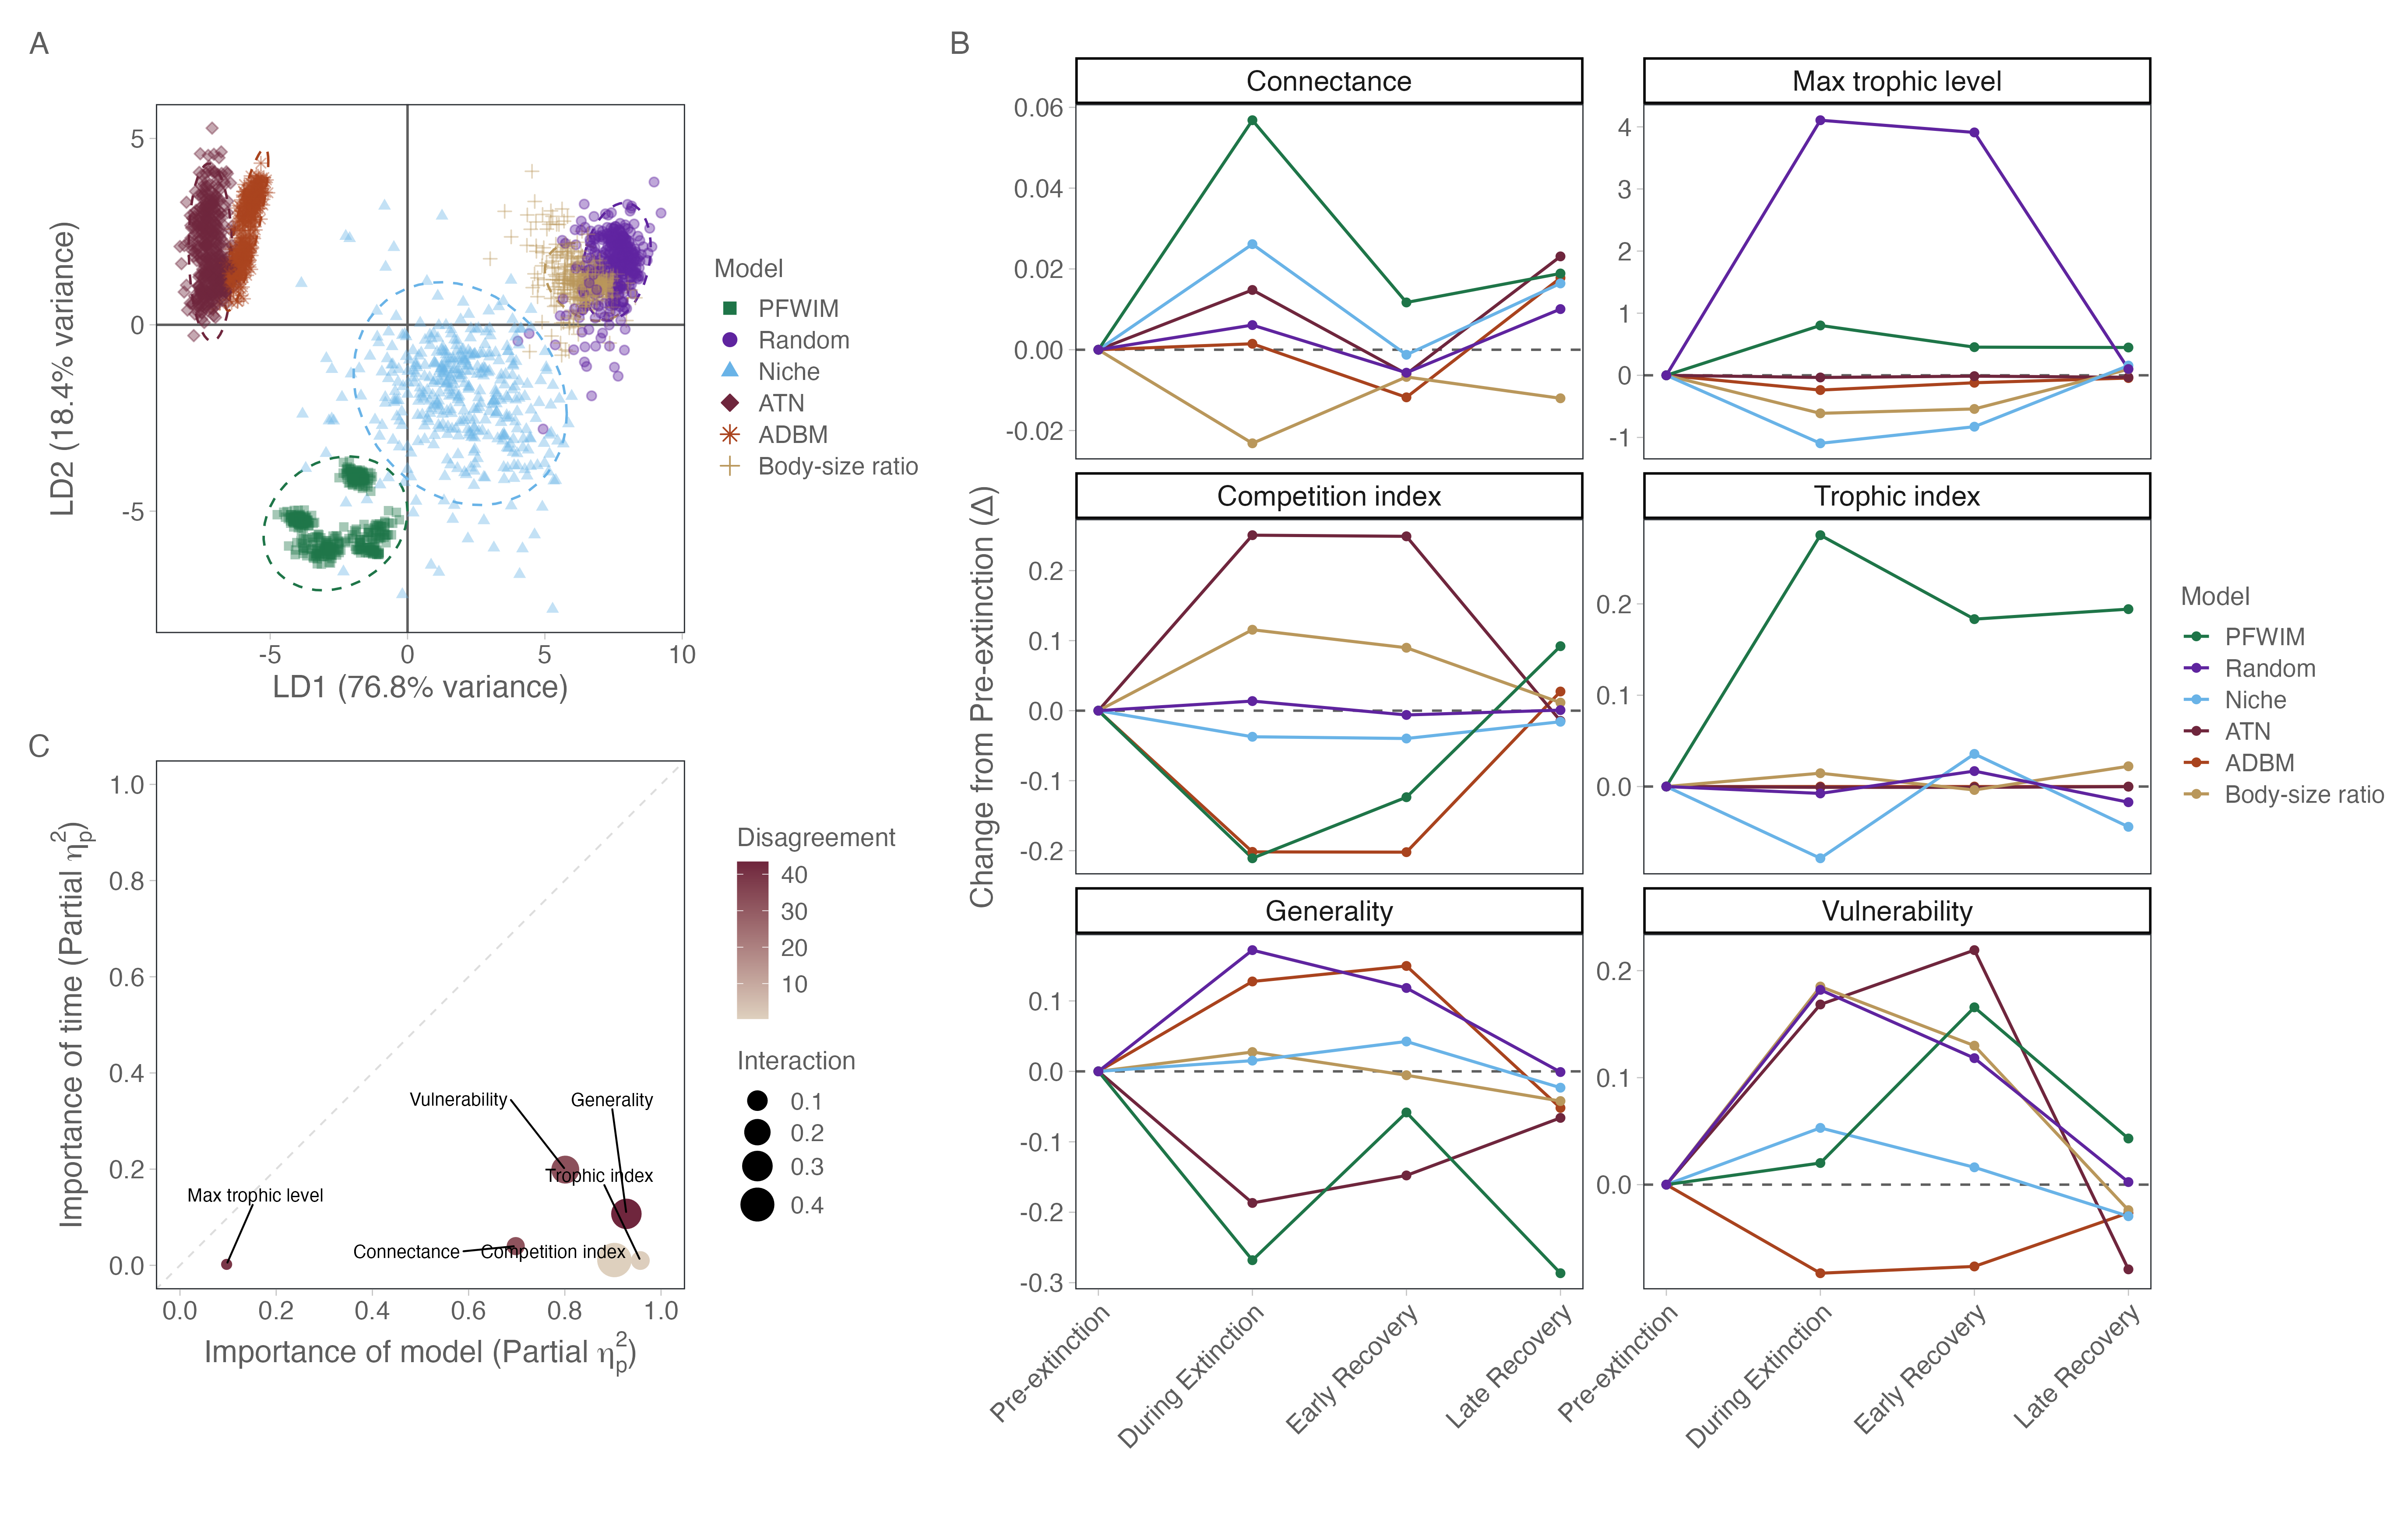
Across modelling approach, network structure (network properties listed in Table 2) differed significantly (MANOVA, Pillai’s trace = 2.79, approximate \(F_{30,11880}\) = 502.1, \(p<\) 0.001), indicating that the model choice systematically alters inferred food web topology. Linear discriminant analysis (LDA) identified two dominant axes of variation, explaining 95.2% of the differences between models. LDA axis 1 (LD1) correlated with trophic index, vulnerability, and generality. LDA axis 2 (LD2) correlated with competition index, generality, and connectance (Figure 1 A; Table S1, Figure S1). Broadly indicating that structural differences are driven by the way in which the models assign links to species as opposed to macro-level network properties such as maximum trophic level.
3.1.1 Variance partitioning of network structure
Permutational multivariate analysis of variance (PERMANOVA) revealed that modelling framework accounted for most of the variation in multivariate network structure (\(R^2\) = 0.597, \(p\) < 0.001), whereas temporal turnover across extinction phases explained a near negligible proportion of variance (\(R^2\) = 0.001, \(p\) < 0.001), alongside the model \(\times\) time interaction (\(R^2\) = 0.03, \(p\) < 0.001), indicating limited but significant time-dependent divergence among models. Thus, differences among models were more than an order of magnitude greater than differences that could be associated with ecological turnover, despite the ETEE being characterised with a significant community turnover.
To determine whether the dominance of the model reflected absolute mean shifts across time, we repeated the analysis after centring network metrics within each time bin. This procedure removes between-phase differences while retaining within-phase structural variation. Even after temporal bin-standardised centering, the model explained the majority of the observed multivariate variance (\(R^2\) = 0.704, \(p\) < 0.001, see Supplementary Material S2 for more details). These results demonstrate that the influence of modelling approach is not driven by temporal mean differences but reflects intrinsic divergence among models in how ecological interactions are organised.
3.1.2 Statistical Drivers of Network Variation
To identify which specific structural properties drive the multivariate separation observed above, we partitioned variance at the level of individual network metrics. Results show that model had a significantly stronger influence on network structure than the ecological signal of species loss. In panel B of Figure 1 for certain network metrics models predict different responses across time (e.g., Trophic Index), as well as differing magnitudes of change (e.g., connectance). A two-way factorial ANOVA across all eight network metrics confirmed that model was the dominant driver of variance, with partial eta-squared values (\(\eta^{2}_{p}\)) exceeding 0.7 for most metrics (Figure 1 C; Table S3), except for maximum trophic level for which \(\eta^{2}_{p} = 0.1\). While time significantly altered network structure (\(p<0\).001), its relative importance remained secondary, typically explaining a smaller fraction of the structural variation. This is clear in panel C of Figure 1 where all metrics are within the bottom-right (model-dominated) triangle (below the dashed line), emphasising that model assumptions outweigh the ecological signal of extinction-driven changes. Furthermore, the high inter-model Coefficient of Variation (CV) observed for some metrics (Table S4, Figure S4) highlights a sensitivity. The properties that are influenced (albeit modestly) by time are also those upon which models disagree most profoundly (deeper colour in panel C of Figure 1). This demonstrates that our understanding of structural food web collapse in the fossil record is highly contingent on the chosen model, especially when examining complex trophic pathways beyond simple macro-scale properties like connectance.
3.1.3 Inferred pairwise interactions vary widely among models
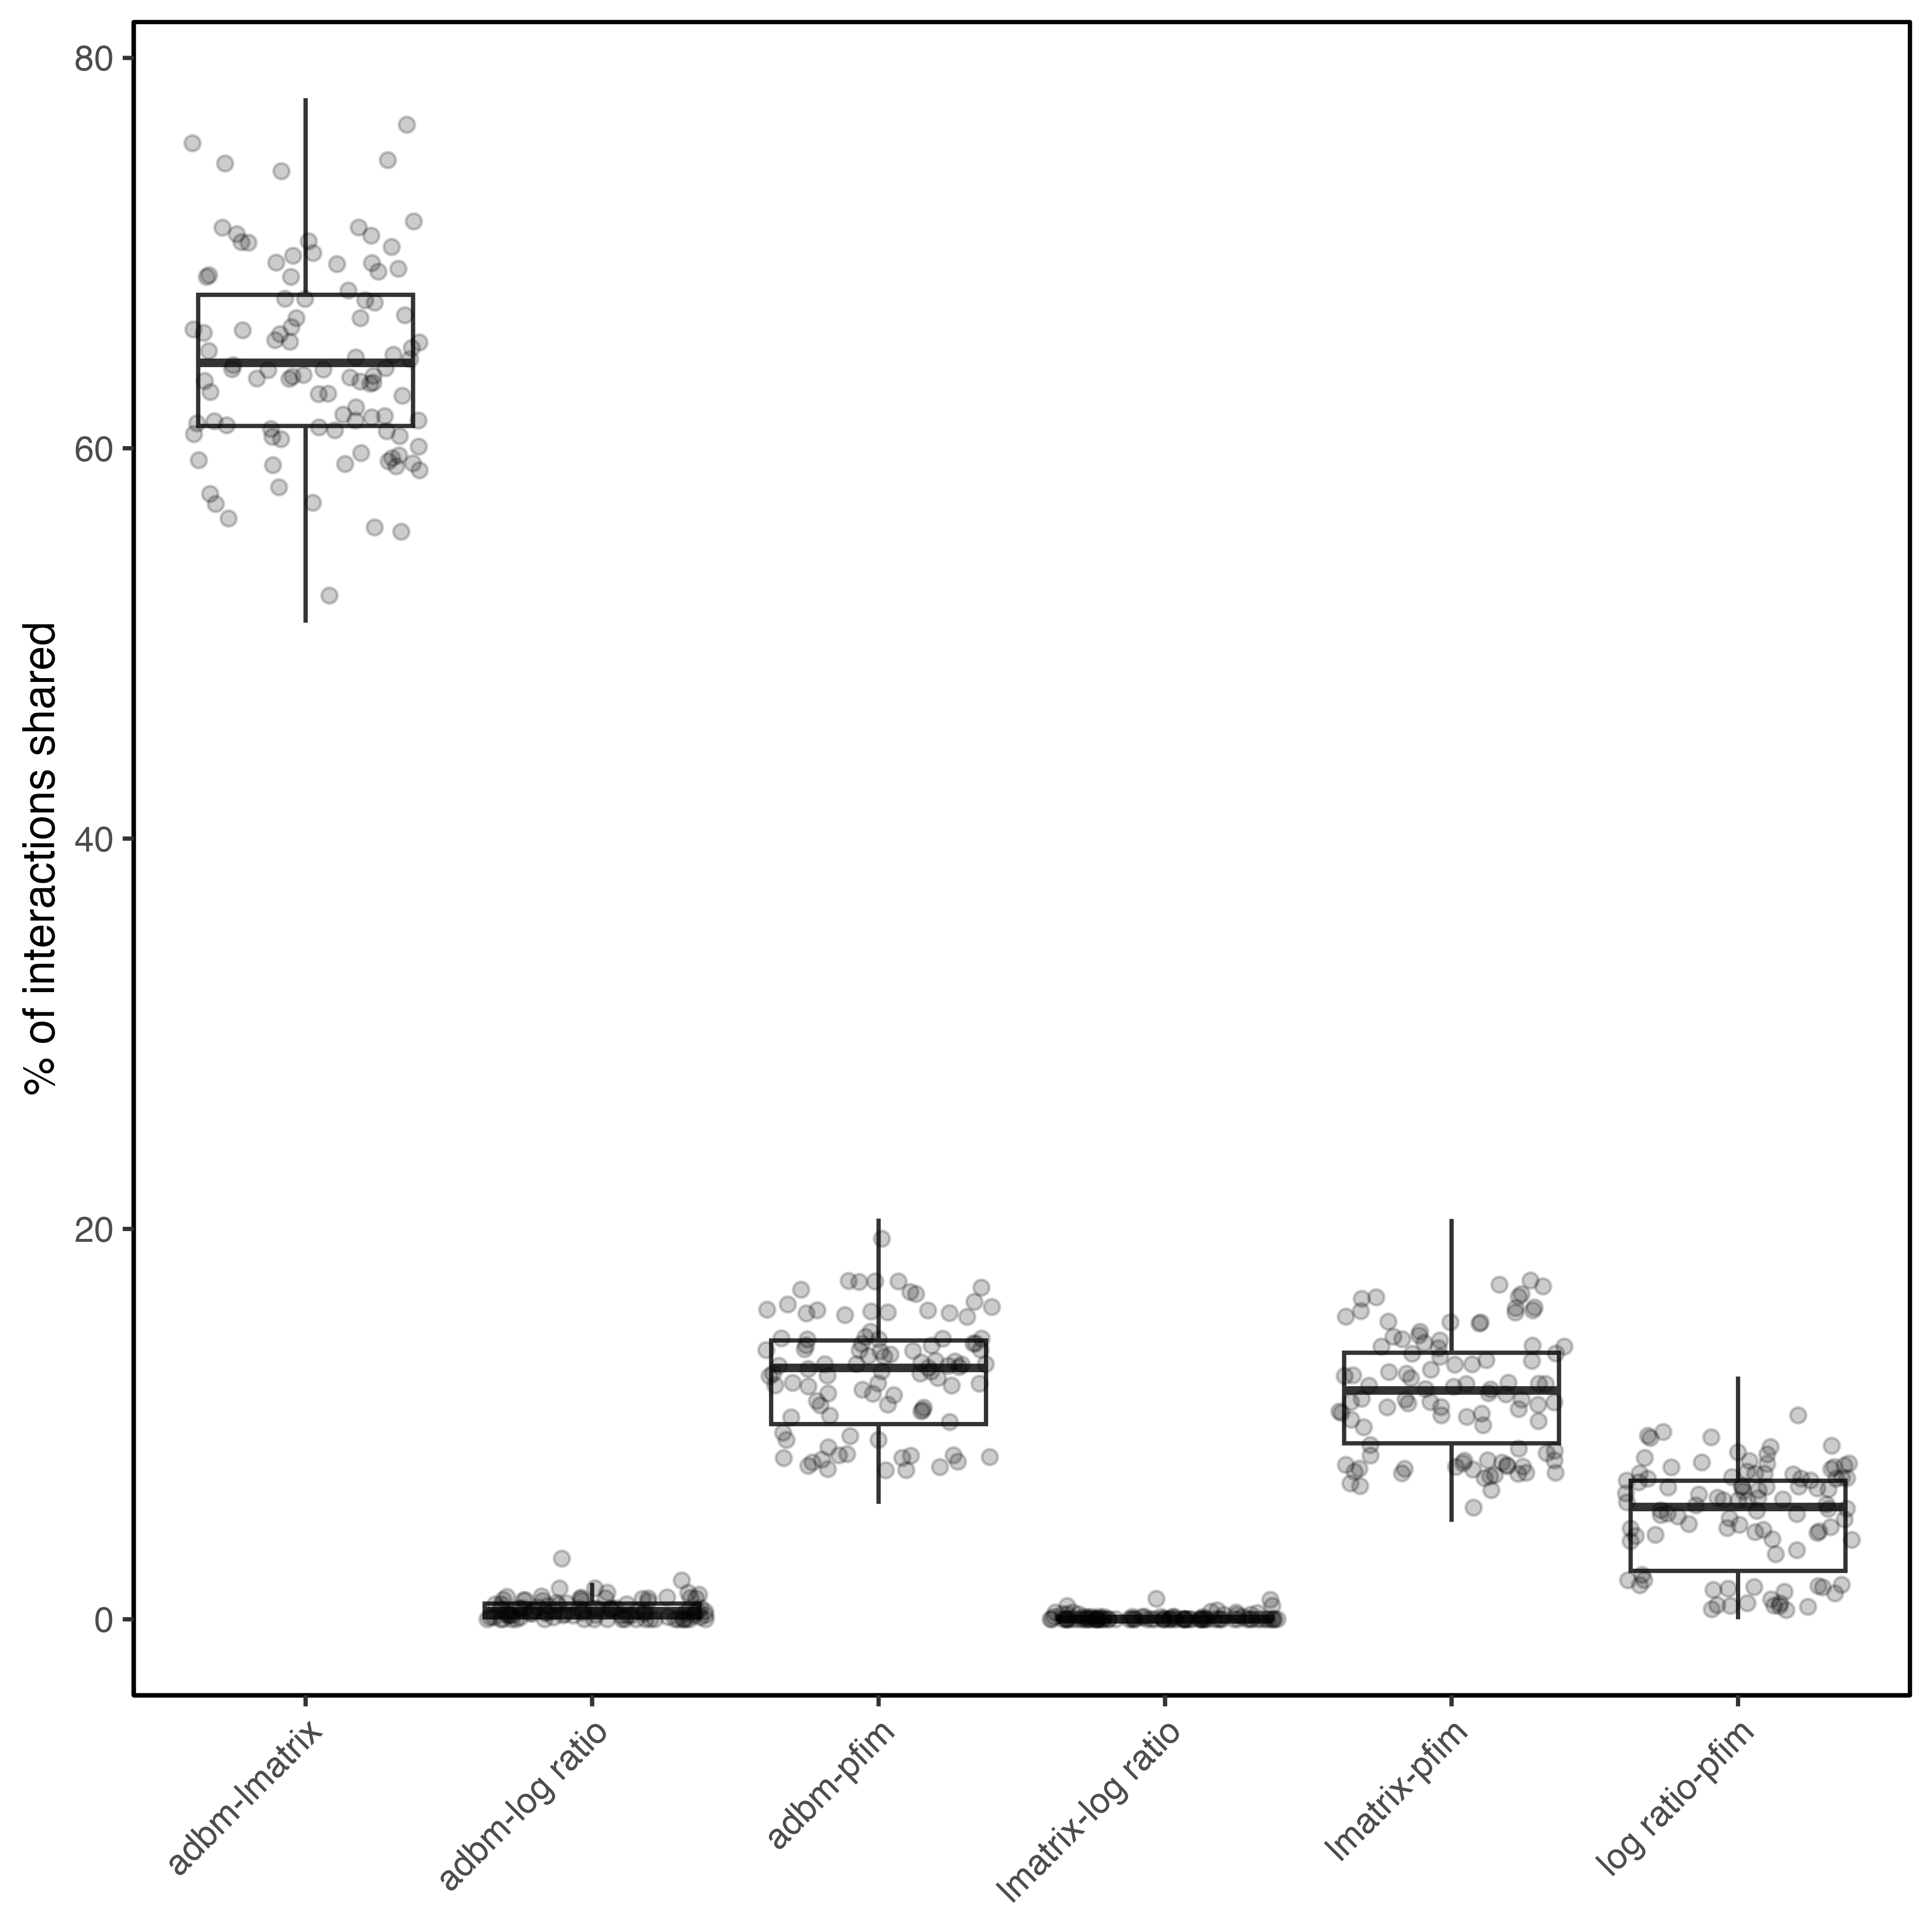
Despite some models showing similar network metrics (e.g., ATN and ADBM, Figure 1), specific pairwise interactions often differed. Pairwise \(\beta_{OS}\) revealed that certain model pairs shared very few links (Figure 2). Perhaps most striking is that the two size-based models (ADBM, ATN) that were broadly similar in structure still showcase a high degree of interaction turnover, demonstrating that agreement in overall network structure does not guarantee agreement in species-level interactions. As the PFWIM is a metaweb model, one would expect that it should have the greatest dissimilarity with the other body-size constrained models. However, although there is a high degree of turnover, this is not notably higher than turnover between the body size models. Overall, we see that at the pairwise level each model tends to have a distinct set of pairwise interaction from the other. Note that the moderate degree of within-model interaction turnover can be ascribed to noise during the network construction process. For the PFWIM networks this is due to the random downsampling, whereas for the body-size constrained models, this is due to body sizes being re-simulated for every network.
3.2 Model choice influences inferred extinction dynamics
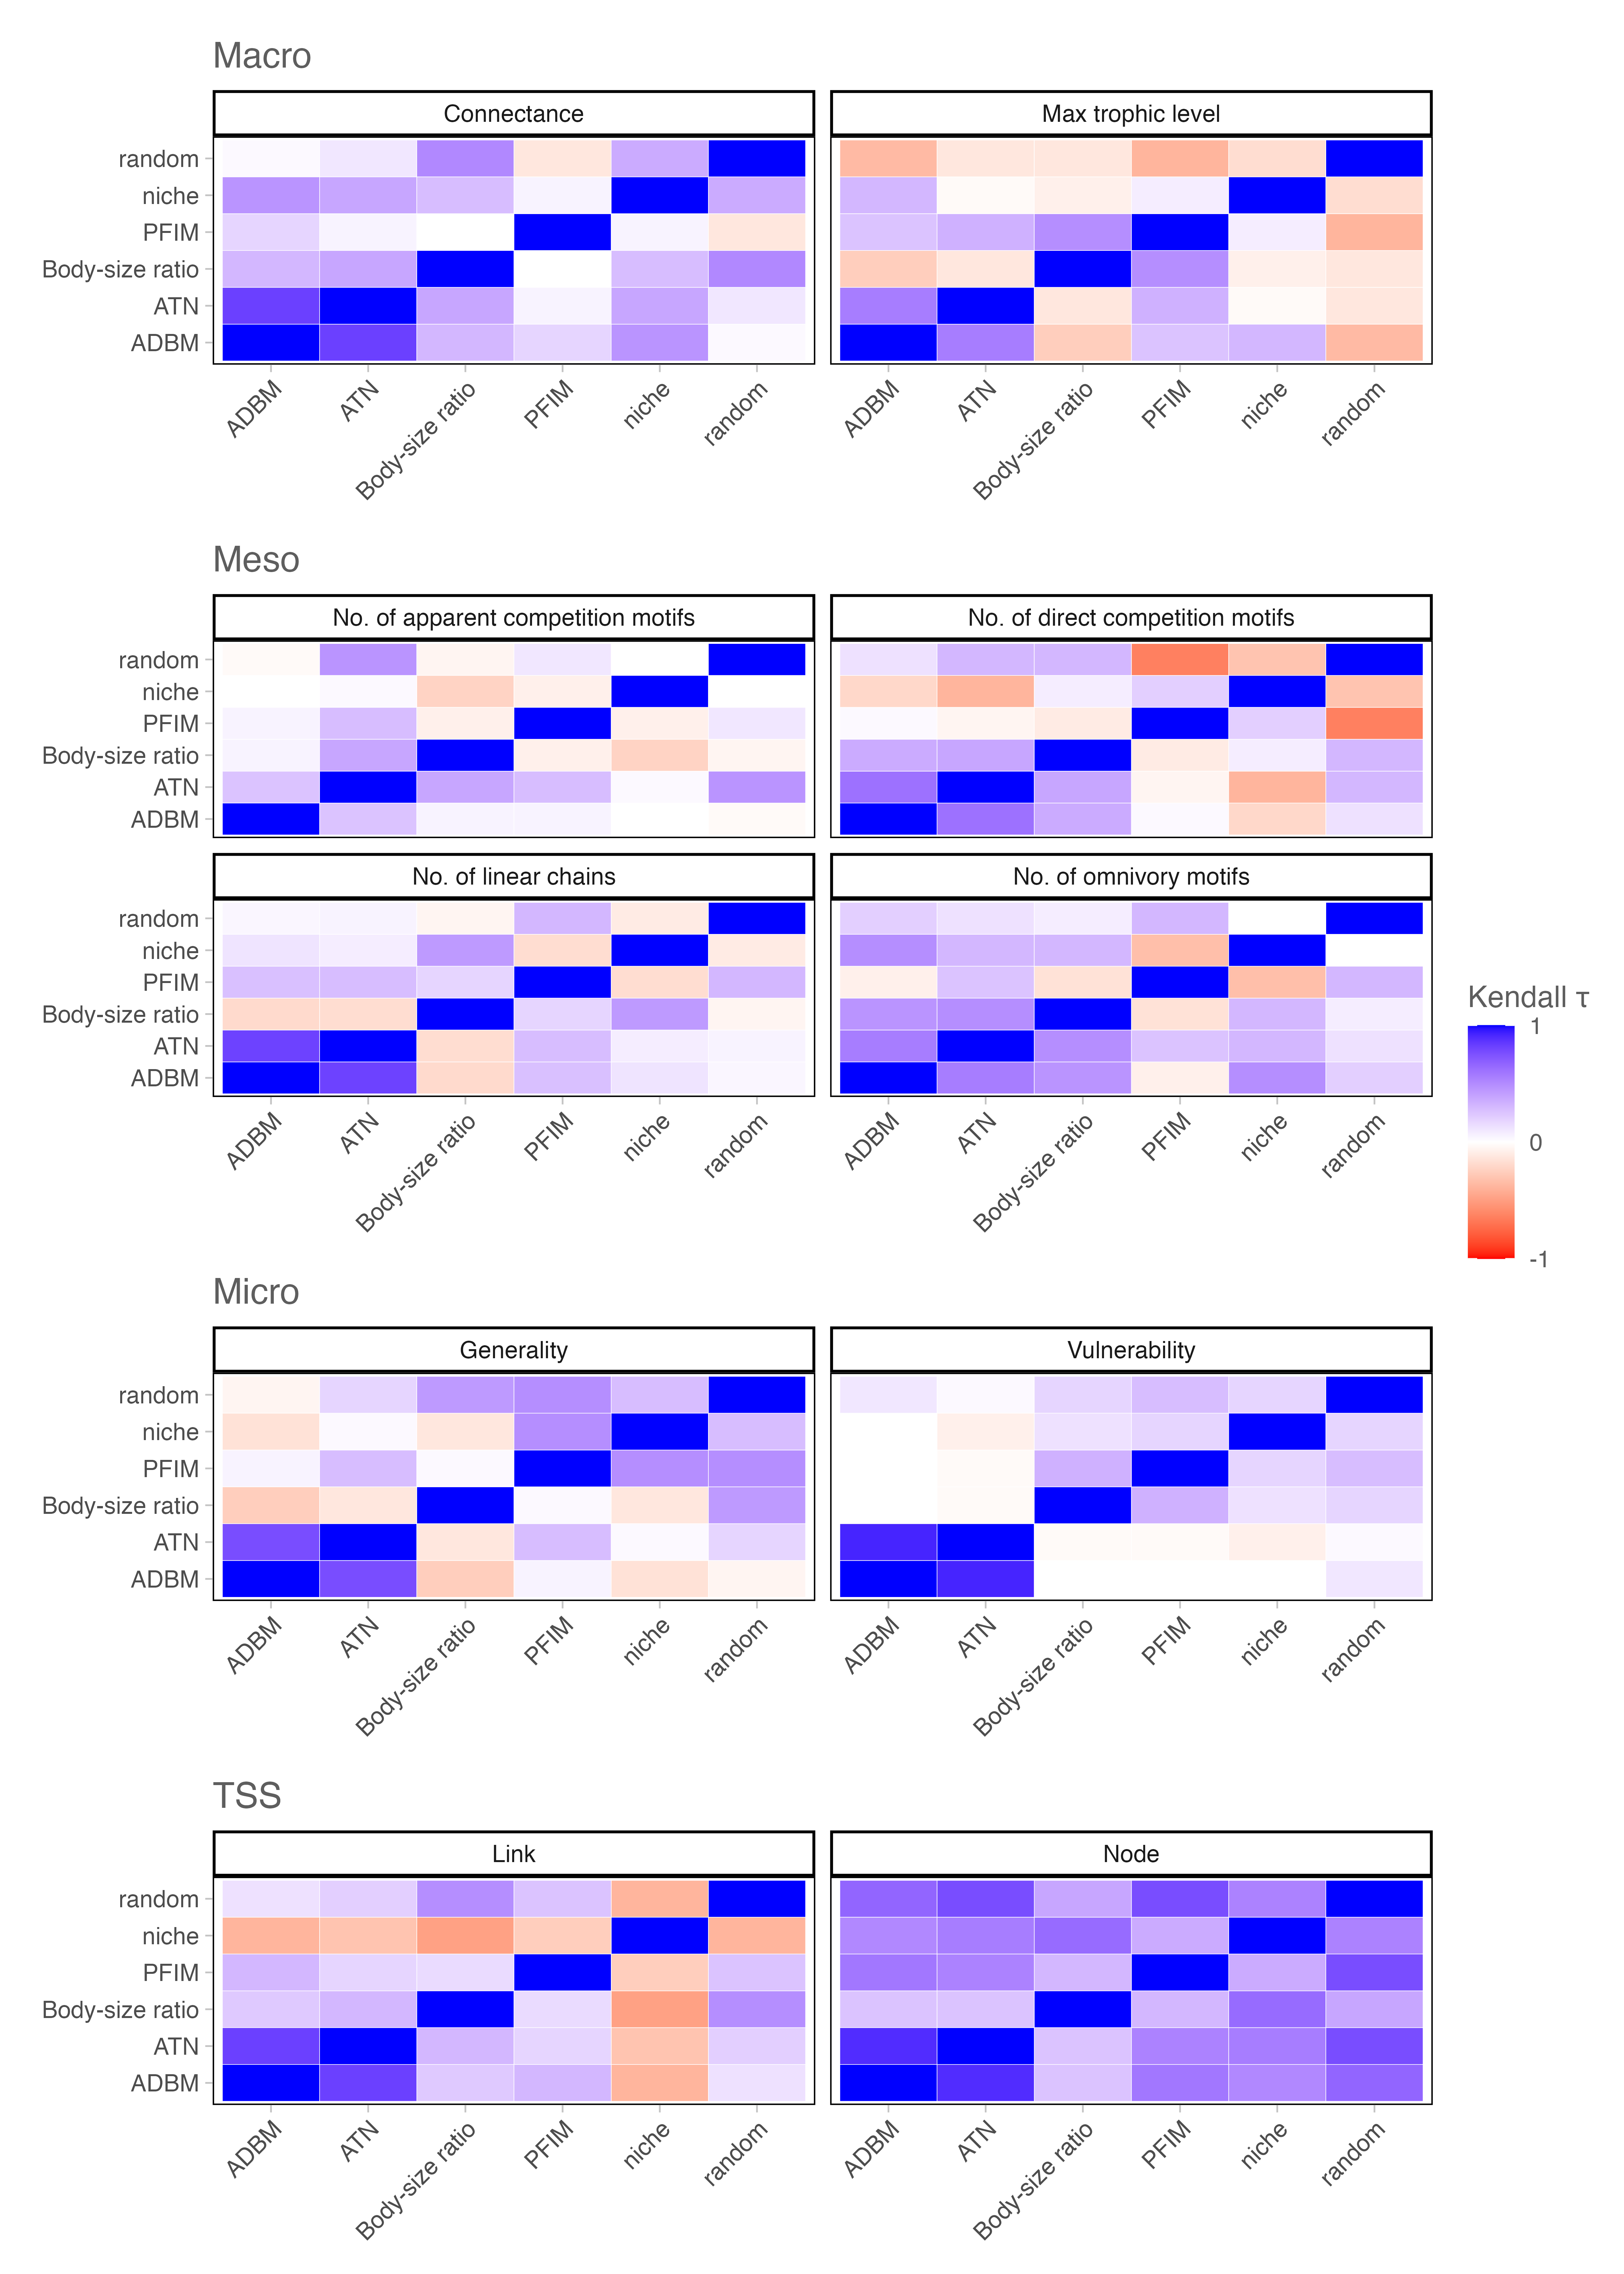
To evaluate how model choice affects inferred extinction dynamics, we compared simulated post-extinction networks to observed networks using mean absolute differences (MAD) for network-level metrics and true skills statistics (TSS) for node- and link-level outcomes (Figure 3). Across models, MAD-based rankings were generally positively correlated (Kendall’s \(\tau \approx\) 0.122 across the structural metrics), indicating weak but generally positive agreement on the relative importance of extinction mechanisms despite the substantial differences observed between modelled network structure. The exception to this is maximum trophic level, where we see more disagreement between the model rankings of extinction mechanisms.
Node-level TSS rankings were similarly consistent across models (Kendall’s \(\tau \approx\) 0.528), reflecting broadly comparable node-level inferences. In contrast, link-level outcomes were far more variable (Kendall’s \(\tau \approx\) 0.143), highlighting that inferences about which interactions are lost or retained during collapse and recovery are highly model contingent. However, we see that models tend to converge on similar species-level extinction patterns, whereas from link-level extinction processes the inferred pathways of interaction loss and cascading dynamics depend strongly on the model.
4 Discussion
4.1 Network reconstruction is not neutral: assumptions shape ecological theory
Food web reconstruction is often treated as a methodologically neutral step, with network properties subsequently interpreted as reflections of underlying ecological organisation. This assumes that reconstructed webs provide structurally comparable representations of ecological communities, such that differences in connectance, trophic structure, motif composition, or robustness reflect biological variation rather than modelling assumptions.
This assumption is important in deep-time paleoecology, where interactions are rarely observed directly and must be inferred through modelling. Although this makes making assumptions unavoidable, it also renders ecological interpretations sensitive to model choice, creating a risk that methodological artefacts are misinterpreted as genuine macroevolutionary or paleoecological signals. The same concern applies to contemporary food webs, especially as the field increasingly adopts prediction-forward approaches to network construction (Strydom et al. 2021).
Our results demonstrate that model choice explains substantially more variation in food web topology than temporal turnover across extinction and recovery phases. Despite sharing an identical regional taxon pool, alternative models generated distinct structural signatures occupying non-overlapping regions of multivariate space (Figure 1 A). Model type remained the dominant driver of structural variation even after accounting for differences between phases, indicating that models impose distinct ‘structural priors’ that shape emergent topology, species roles, and predictions of extinction dynamics. Network structure is therefore determined not solely by ecological communities, but jointly by ecological data and the assumptions used to infer interactions (Strydom et al. 2026; Gauzens et al. 2025).
Variance partitioning further showed that model choice dominated variation across individual network properties, suggesting that its influence extends across multiple dimensions of network organisation rather than being driven by a single metric. Although this may partly reflect the propagation of constraints on individual structural properties into emergent network characteristics (Poisot and Gravel 2014; Michalska-Smith and Allesina 2019), constraining connectance to be identical across all replicates retained structural differences between models, albeit to a lesser degree (Supplementary Material S2). Notably, the properties exhibiting the strongest temporal signals also showed the greatest inter-model disagreement, suggesting that temporal trends are hardest to resolve where models diverge most strongly (Figure 1 C).
Model disagreement was even more pronounced at the level of individual pairwise interactions. Models producing structurally similar networks often inferred substantially different sets of species-level interactions (Figure 2), suggesting that interaction predictions are sensitive to model choice. This indicates that models can impose distinct rules governing network structure without agreeing on the specific links between species pairs. Importantly, this comparison concerns agreement between predictions, not their accuracy.
This pattern is evident in the ATN and ADBM models. Both showed substantial variation along LDA axis 2, strongly correlated with the competition index, but relatively little variation along axis 1, strongly correlated with the trophic index and vulnerability (Figure 1 A). Together with the limited variation in trophic index across extinction and recovery phases (Figure 1 B), this suggests that these models constrain aspects of trophic structure, including the balance of linear chains and omnivory, despite variation in competitive structure. However, their structural similarity does not translate into agreement on individual interactions (Figure 2). Thus, models shape not only the overall structure of inferred food webs but also the ecological interactions through which that structure is realised.
4.2 Node- vs link-based inference
Importantly, the sensitivity of extinction simulation rankings to network type was not uniform across levels of inference. Node-level extinction rankings were broadly consistent among models, whereas link-level outcomes were model contingent (TSS panel, Figure 3). This likely reflects the fact that, for node-specific specifications, primary extinction order is determined by species traits and is therefore consistent across network types, while link recovery is model dependent. The similarity in TSS scores, which evaluate the identity of surviving species, further suggests that secondary extinctions were also broadly consistent. However, when primary extinction sequences are determined by link-level traits, which depend on the inferred network structure, we see model-specific differences. This suggests that broad species-level inferences may be robust across plausible interaction architectures, and that models are broadly assigning species to the same trophic positions. However, conclusions about interaction loss, retention, and reorganisation depend more on how specific links are assigned to species.
This distinction challenges a central ambition of food web ecology related to using interaction structure to identify the mechanisms underlying stability and collapse. While broad patterns may be robust across models, mechanistic explanations are far less secure. Had Dunhill et al. (2024) used a model other than PFWIM, the inferred drivers of extinction and recovery may have differed substantially. If extinction mechanisms vary across equally plausible reconstructions, mechanistic narratives derived from a single inferred topology may overstate their precision. The apparent determinism of extinction cascades may therefore reflect model-imposed structure as much as ecological inevitability.
4.3 Implications for network-based research
These findings have important implications for comparative network studies. Because different models encode different ecological assumptions, observed differences among networks may partly reflect model choice rather than ecological processes (Brimacombe et al. 2023, 2024). Without explicit standardisation or sensitivity analysis, methodological heterogeneity can be mistaken for biological signal. Food web ecology has devoted substantial effort to understanding how topology shapes dynamics (Allesina and Tang 2012; Dunne et al. 2002), but comparatively less attention has been paid to how reconstruction methods shape topology. Our findings indicate that these questions cannot be separated. However, disagreement among models does not mean that any single approach is necessarily wrong (Stouffer 2019; Petchey et al. 2011). Rather, different frameworks emphasise different ecological constraints, such as trait compatibility, energetic optimisation, or topological regularity. The challenge is therefore to match the model to the question at hand.
As network approaches are increasingly used to investigate ecological organisation across latitudinal gradients (Tylianakis et al. 2008), climate-driven changes (Gilman et al. 2010), and stability under species loss (Hao et al. 2025; Marjakangas et al. 2025), we need to consider how model choice may influence these results. Studies frequently interpret variation in connectance, trophic height, interaction \(\beta\)-diversity, and robustness as evidence of ecological differentiation across regions or through time (e.g., Pellissier et al. 2018; Trøjelsgaard and Olesen 2016). Our results show that model choice can systematically alter inferred topology and disturbance dynamics even when species composition is held constant. Apparent differences in network structure across spatial or climatic gradients may therefore reflect model choice as much as underlying ecological processes. Comparative studies using different modelling approaches should consequently standardise their methods or explicitly quantify the sensitivity of their conclusions to alternative network representations.
No single model is universally correct. Rather, each represents a distinct hypothesis about how ecological interactions are constrained (Petchey et al. 2011; Strydom et al. 2026). Model choice should therefore be treated as part of hypothesis specification, rather than as a technical step preceding analysis. Researchers must align network-construction approaches with their ecological questions, whether these concern potential interactions, realised diets, or broad structural properties, while recognising that the resulting inferences may differ in their sensitivity to model choice. Box 1 translates these findings into practical guidance for selecting network representations and evaluating the robustness of the conclusions drawn from them. Recognising this asymmetry is essential for distinguishing robust ecological patterns from conclusions contingent on modelling assumptions.
A more robust approach to food web ecology would treat network construction as a testable component of ecological inference, incorporating probabilistic link prediction where appropriate and routinely evaluating the sensitivity of conclusions to alternative representations of interaction structure. Such an approach aligns with recent advances in probabilistic and ensemble network modelling (Banville et al. 2025; Poisot et al. 2016; Wootton et al. 2021). More fundamentally, it recognises that reconstructed ecological networks are not simply representations of communities, but model-dependent representations through which ecological patterns are identified and interpreted. Their value as macroecological state variables therefore depends not only on their capacity to capture ecological organisation, but also on whether the patterns they reveal persist across plausible representations of interaction structure.
5 Conclusions
Ecological network reconstruction is not a neutral methodological step; it shapes ecological inference. By applying six models to the same species pool, we demonstrate that model choice influences network structure, interaction identity, and inferred extinction dynamics. Although broader patterns, such as species retention across extinction events, were relatively robust, fine-scale interactions varied considerably among models, highlighting that robustness at one level of ecological organisation does not necessarily extend to others. This has implications beyond paleoecology, as differences in network properties between communities may reflect reconstruction assumptions rather than ecological processes alone. Reliable macroecological inference therefore requires comparing alternative network representations, selecting models suited to specific research objectives, and evaluating sensitivity at the level of ecological conclusions. Such comparisons help distinguish robust patterns from those contingent on modelling assumptions. Ultimately, the value of ecological networks lies not simply in reconstructing ecological structure, but in establishing which inferences remain reliable across plausible representations.
Data and Code Availability Statement: The empirical data, derived network datasets, and all analysis scripts are archived in a public Zenodo repository (DOI: 10.5281/zenodo.21200527), which includes a complete README file describing software dependencies, execution order, and reproduction instructions.
Acknowledgements: TS, BK, APB, and AMD received funding from NERC/NSF grant number NE/X015025/1.