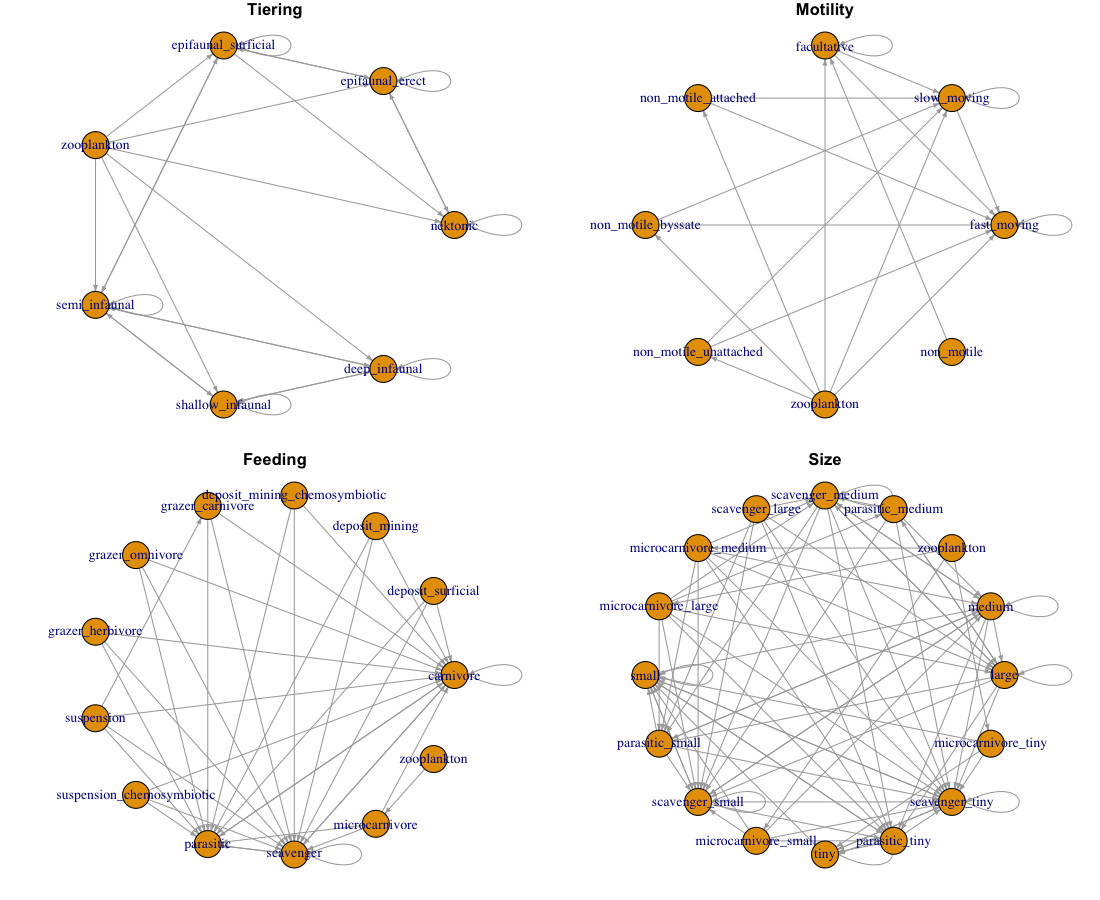
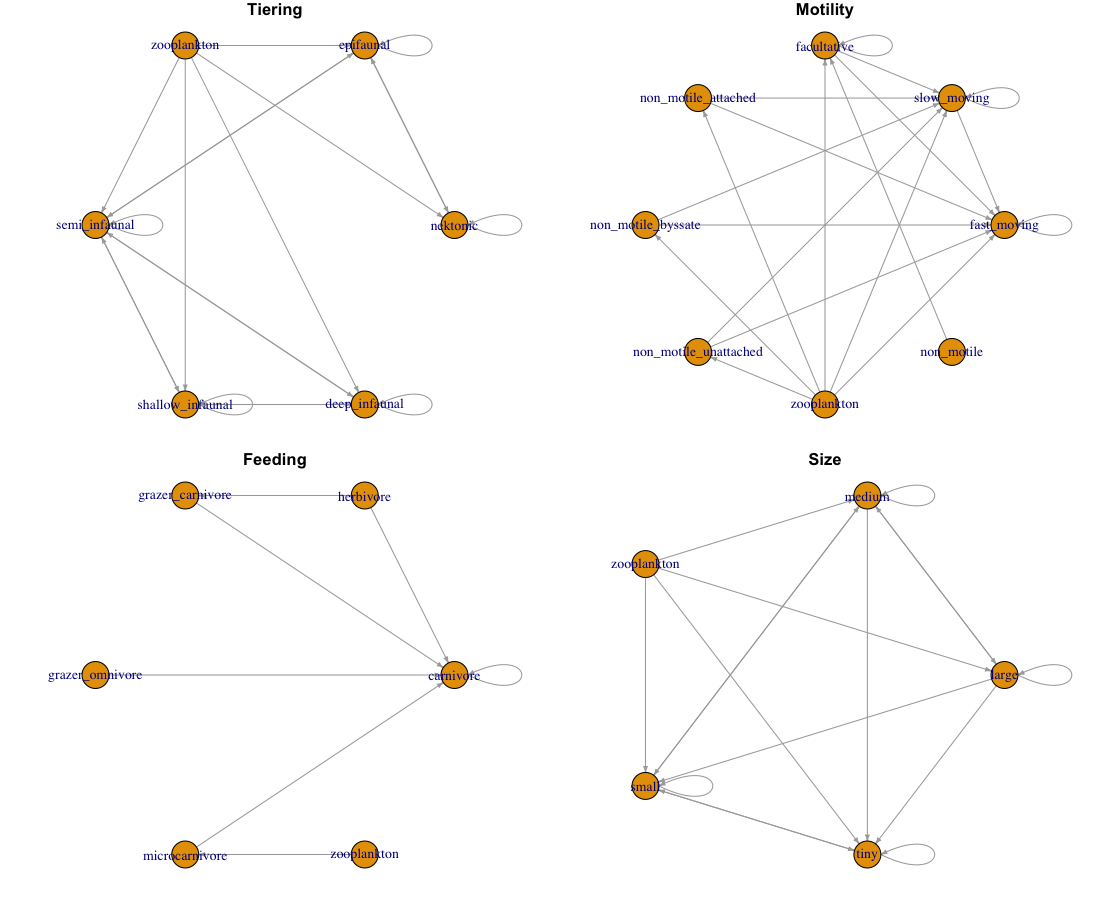
One of the challenges with the PFIM is that there are many ways to formalise the mechanistic rules that determine feeding interactions. What is unclear is how the different rule sets may impact/alter the resulting network structure. Here the aim is to identify some of the broader philosophical ‘groups’/approaches to defining the mechanistic rules within the PFIM and comparing the resulting network that they construct.
How we specify rules
Maximal Rules
This approach focuses on hyper specific traits for the different species. This allows the user to ‘force’ specific feeding rules and make sure that they are met. For example if looking at the size classes we can see that there are additional traits added to the size classes to ensure that e.g., microcarnivores both consume and are consumed by the correct species
Minimal Rules
Here we take a minimalist approach to defining the traits of species so that there are no ‘equivalent’ traits that are actually synonyms since they have the same feeding rules as well as ‘forcing’ certain feeding patterns.
Size Rules
Instead of using categorical size classes as per Shaw et al. (2024) we could use the estimated sizes of different species. As is the norm (e.g., Petchey et al. 2008) we can define the ‘size rule’ so that consumers must be larger than their resource. In theory moving from categorical to continuous sizes for species would give a more stringent set of size-based feeding rules and we might expect there to be a decrease in the number of links between species.
How we specify species
Trophic species
Because there are many species that might have the exact same set of traits (and thus the exact same set of feeding links) we can instead ‘collapse’ species to represent trophic species. Theoretically this would remove all ‘redundant’ links in the system BUT it comes at the cost that we lose the species specificity we would have with other networks.
Including ‘non-trophic’ species
The inclusion of parasites and scavengers represents the inclusion of links that ‘operate’ in a way that is different from the traditional definition of a feeding link. Scavengers are not actively removing individuals from a population but are rather capitalising on ‘dead’ biomass and (generally) for a scavenger the taxonomic identity/ traits of a species i.e., the basis for feeding rules is fundamentally different. Parasites could arguably be viewed the same as herbivores — BUT they are usually highly specialised and complicate our understanding of food webs since they will typically not be predated upon i.e., will have a low degree of vulnerability and will create a lot of short chains in the network e.g., parasites of herbivores would be ‘top predators’ since they would not be predated on by other species
In conclusion although scavengers and parasites are present in communities there are not 100% compatible with the traditional definition of a food web - especially in the way that PFIM specifies feeding rules.
Assumptions on structure
Including a basal node
Shaw et al. (2024) includes a basal node in their networks. Philosophically having a rooted network (basal node) does not make sense in the PFIM space of defining feeding rules. However there is an argument to be had that having a rooted network allows one to ‘protect’ the basal species in the network.
Downsampling
Although PFIM as a network generating tool falls firmly within the metaweb space there is the argument to be had that owing to the coarse granularity of paleo communities (aggregated over large spatial and time scales) means that the resulting networks is ‘over represented’. This begs the question of if we should be downsampling these metawebs to have them represent a slightly more ‘ecologically plausible’ network configuration. Roopnarine (2006) developed a downsampling approach that removes links between species based on the generality of a species.
Results
Different structural features
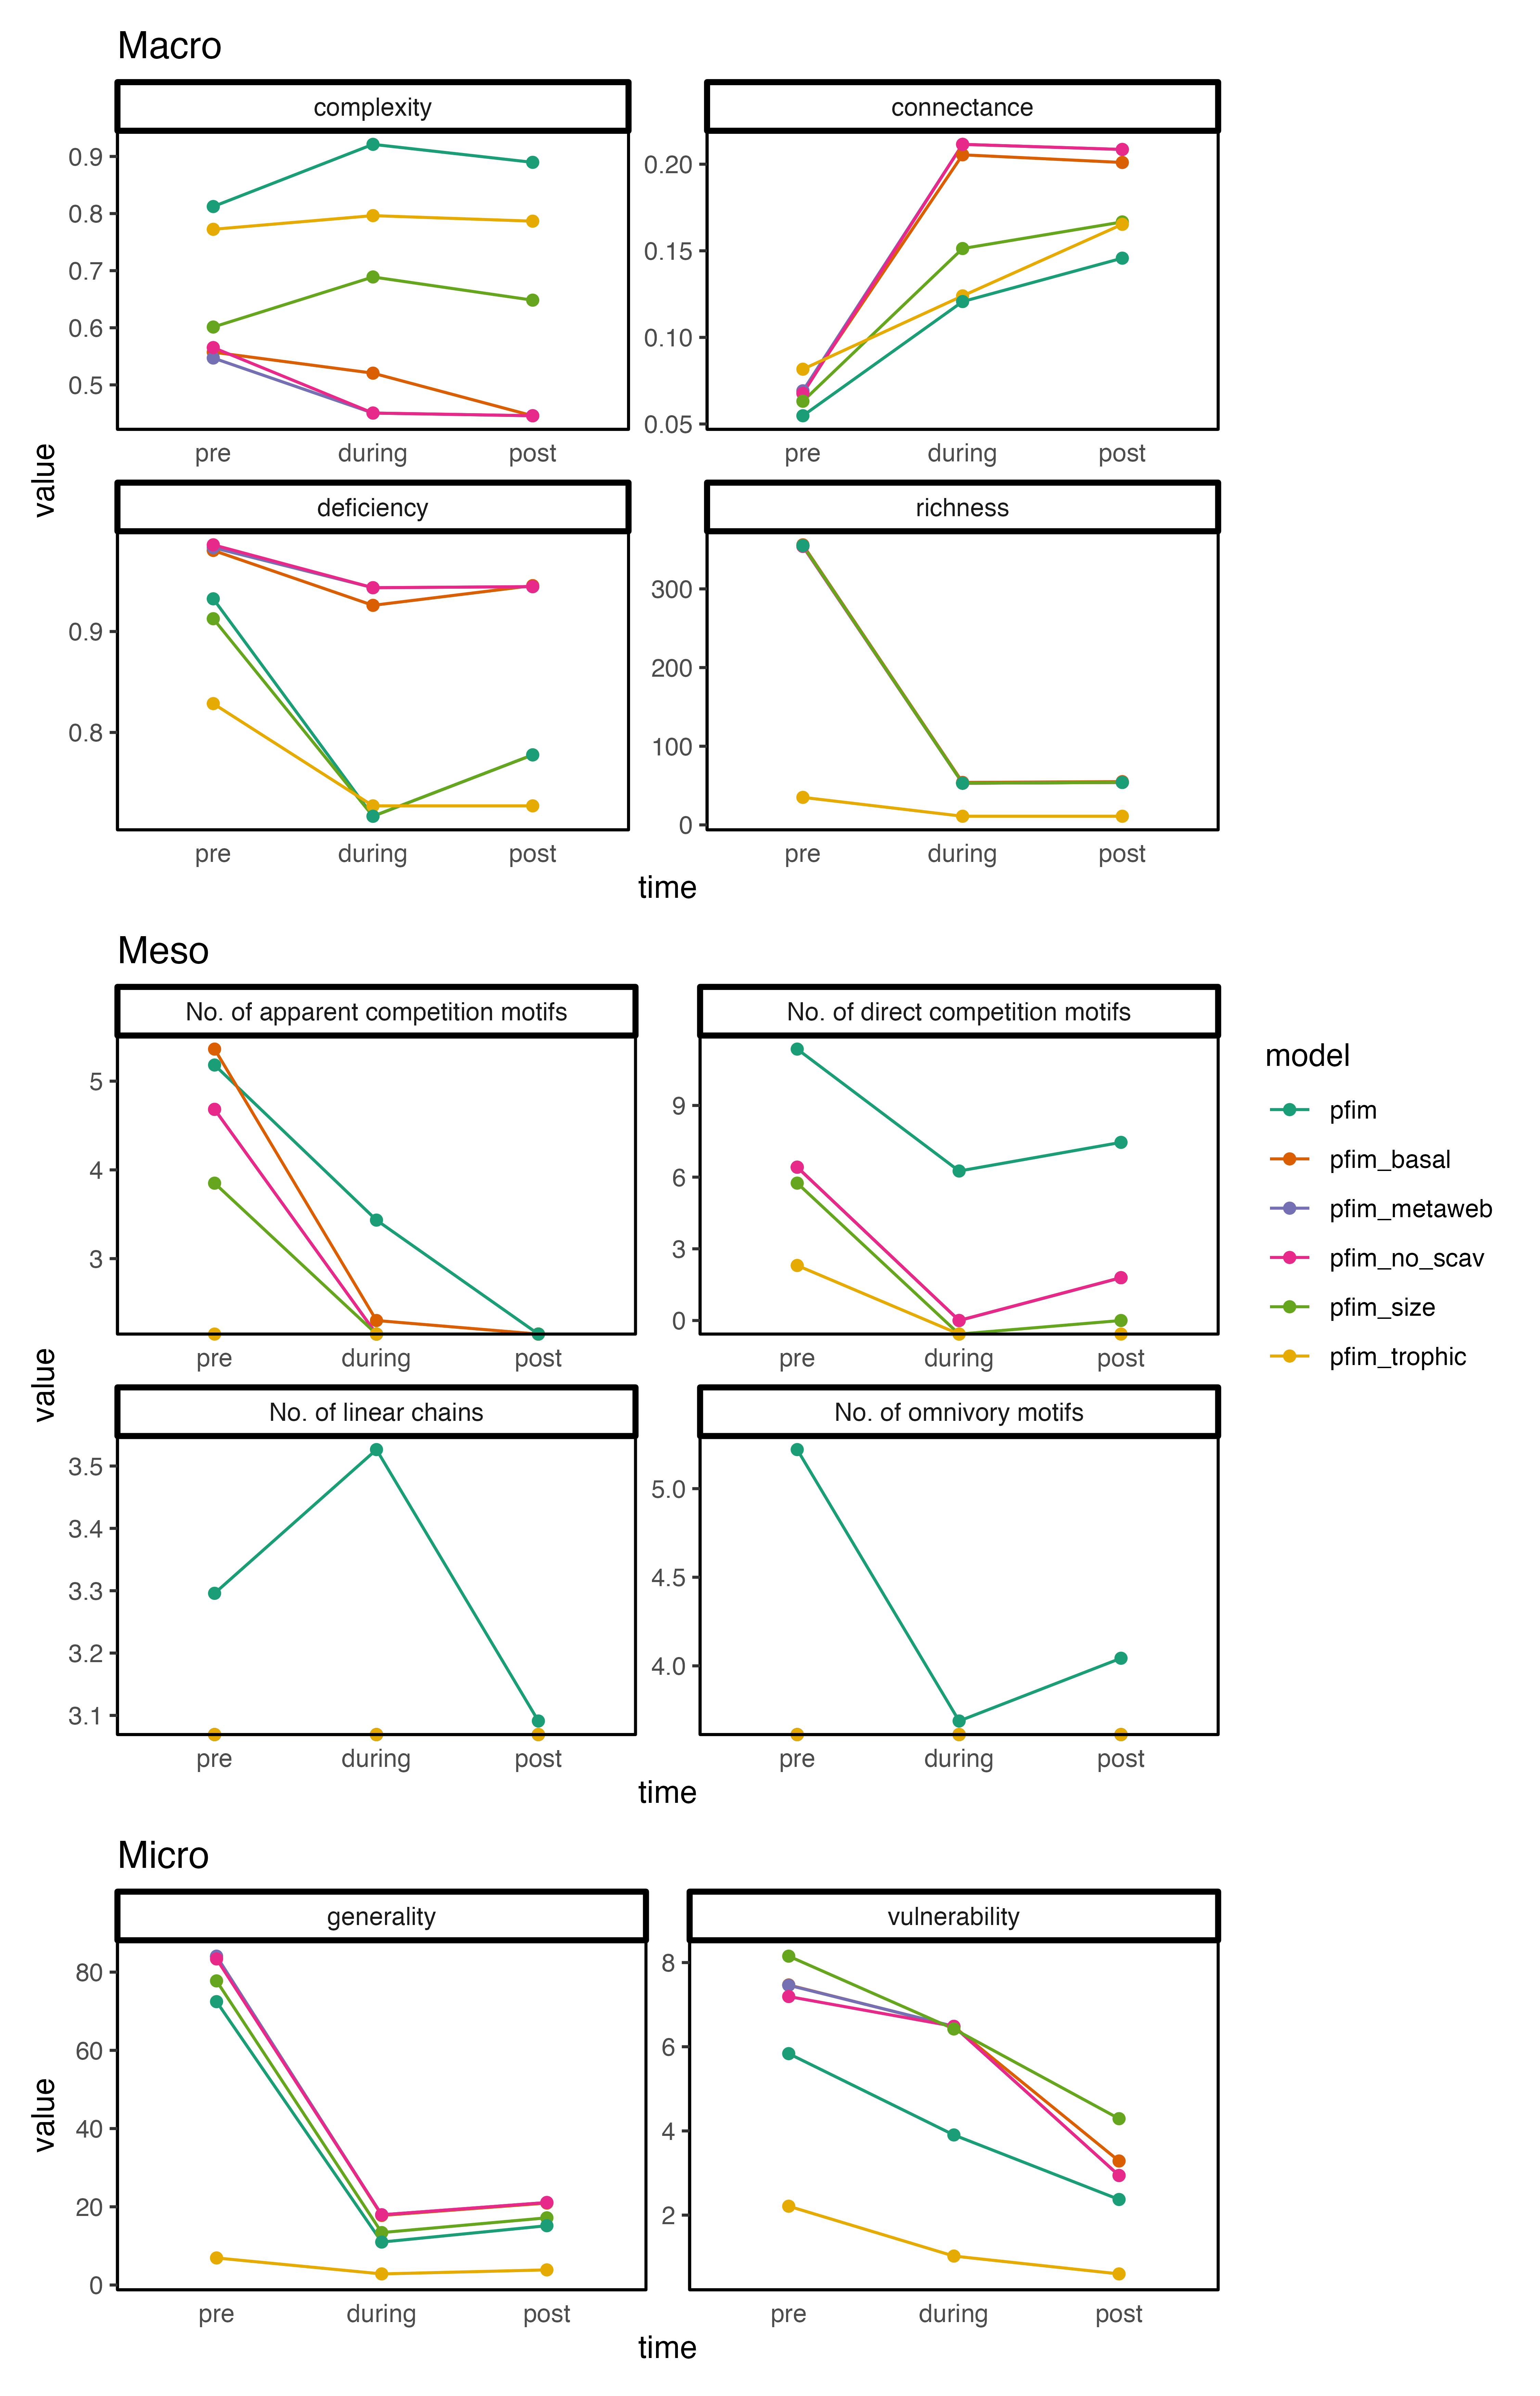
Broadly speaking we observe the same ‘patterns’ over time for the different networks and values are not grossly different (eye test). Often we do see the trophic networks deviating a bit from this generalisation but that makes sense since the communities are more ‘contracted’.
Overall similarity/clustering
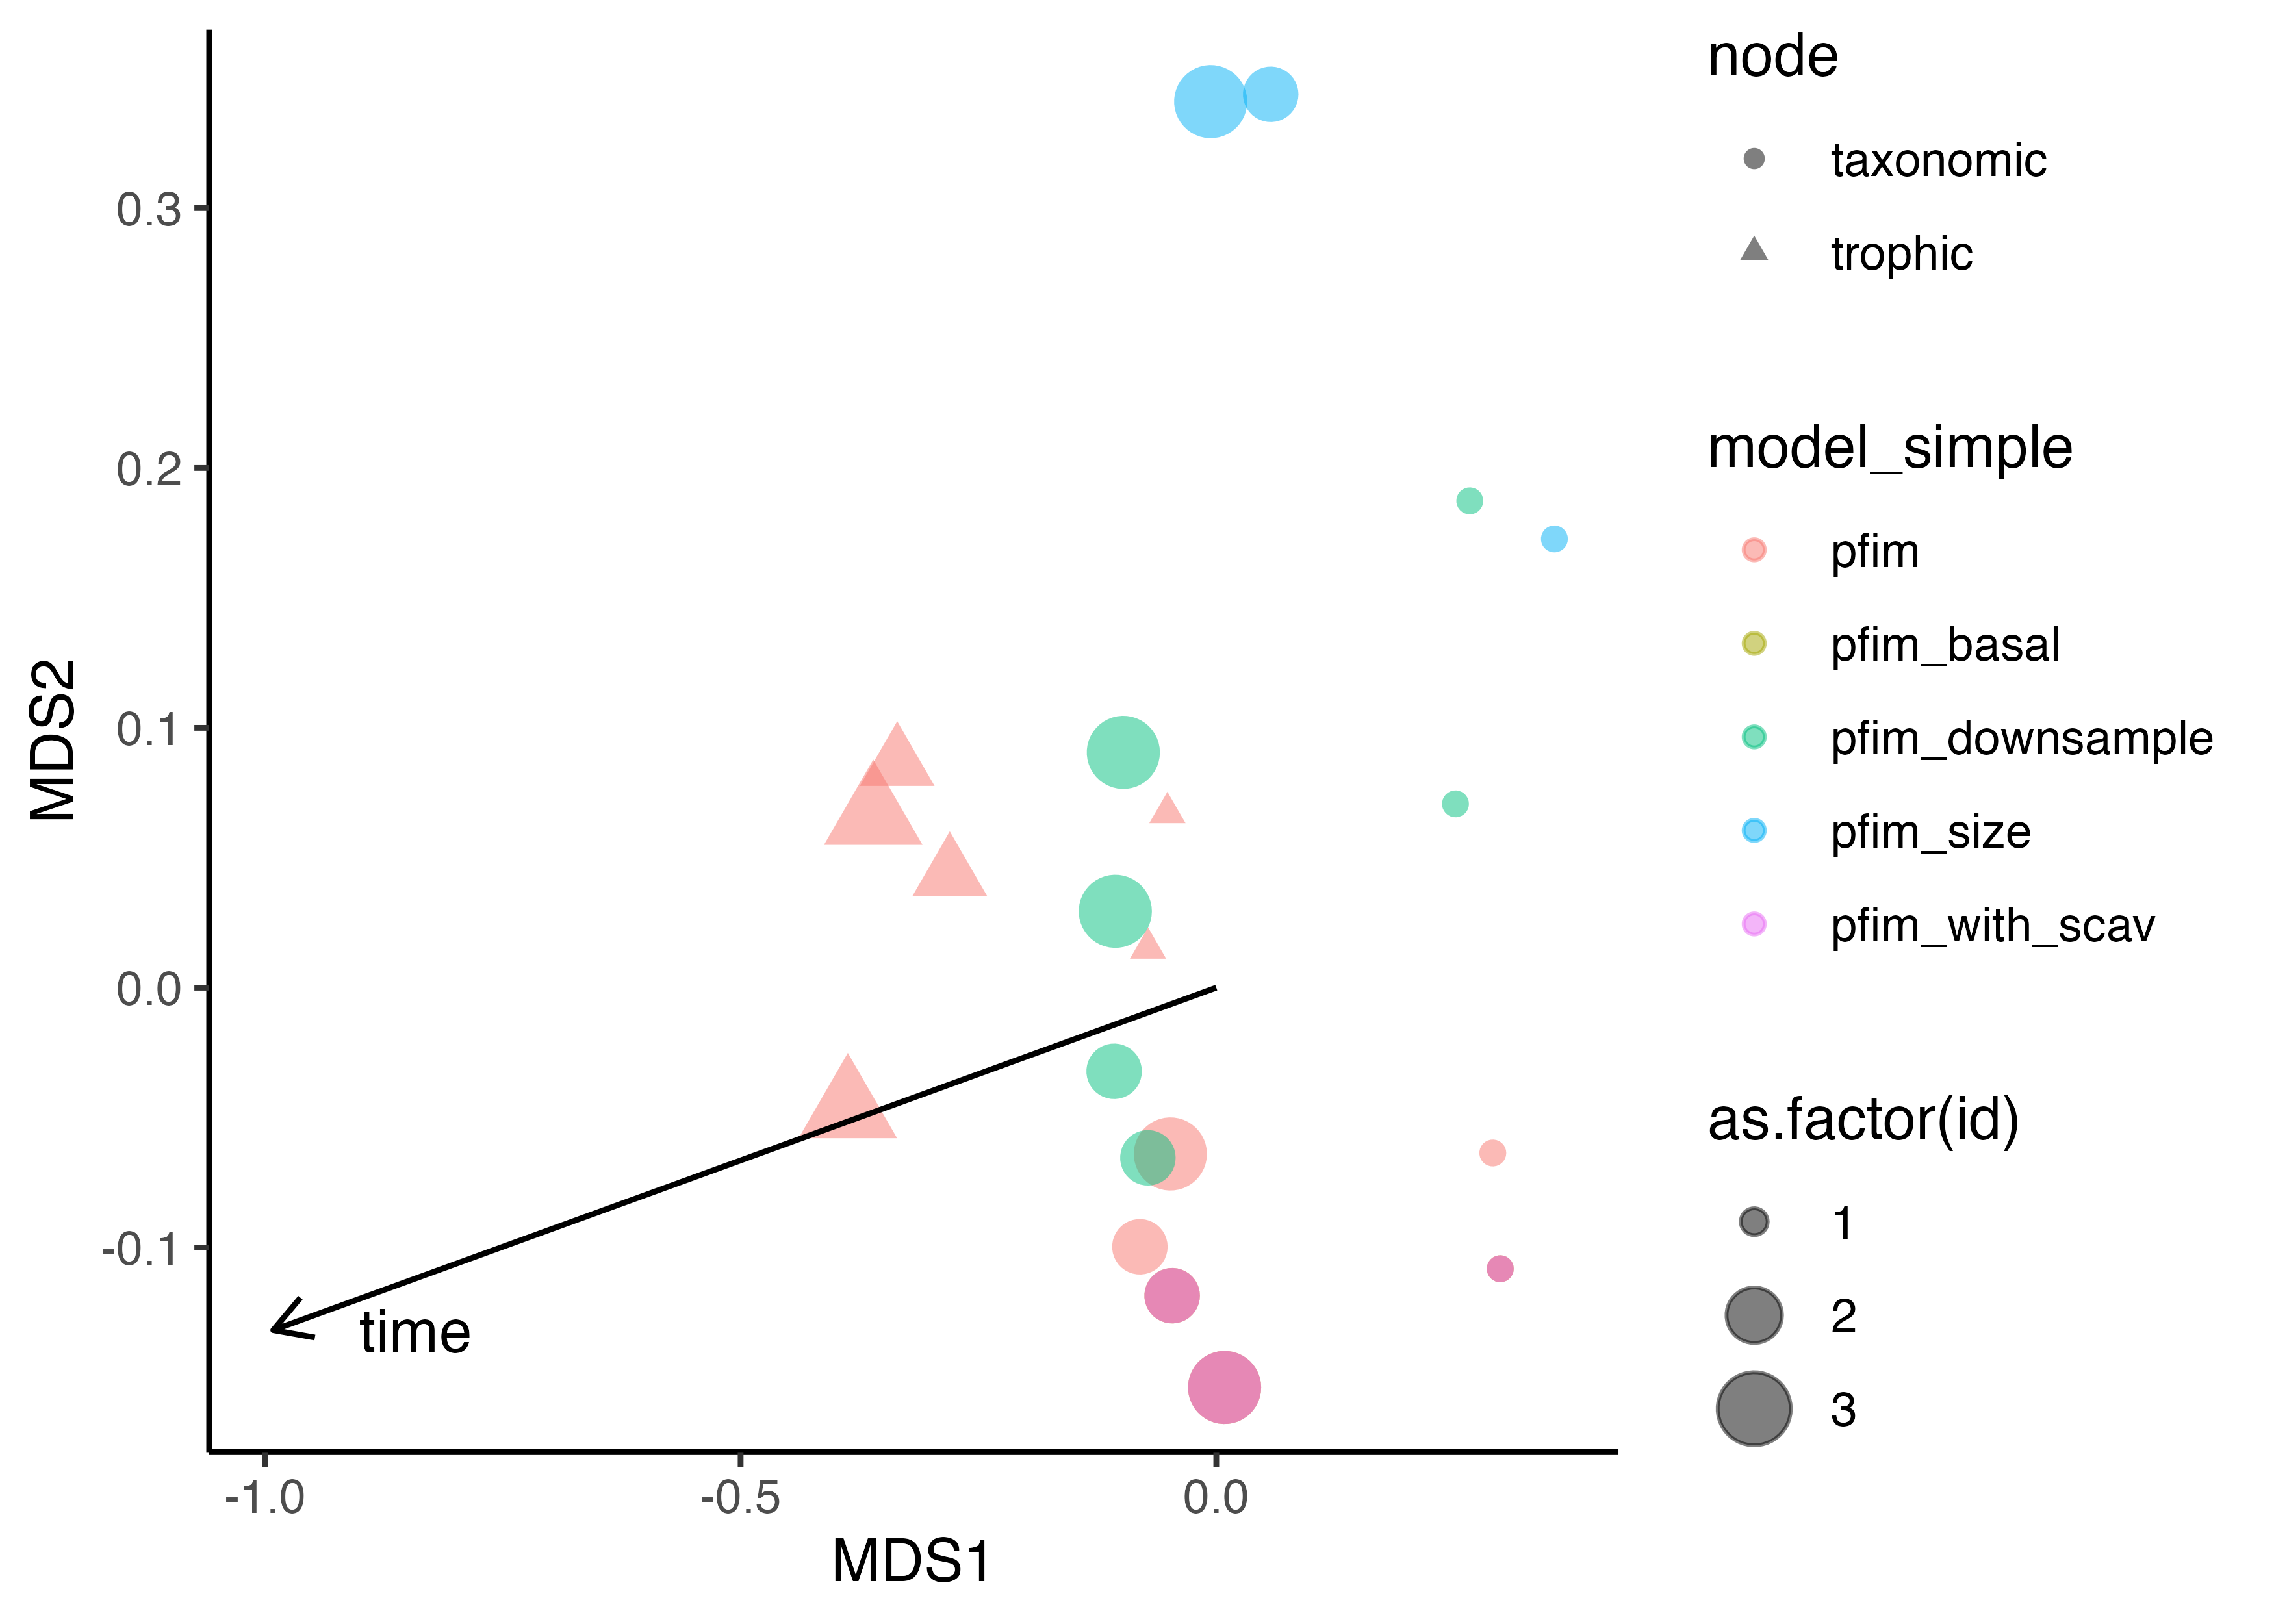
It might also be useful to compare the networks as a ‘whole’ i.e., looking at all traits at the same time. Again we see the trophic networks clustering (to be expected). Interestingly the ‘pre communities’ tend to cluster which I take to mean that the differences between time frames is a stronger signal than the different network construction approaches (broadly).
Redundancy? Structure?


